What are dashboards?
A page of questions that keep answering themselves, each one worked out by an agent against your live data.
Someone asks how many orders are still open, and the answer takes three people and an afternoon. Next month the same question comes round again. A dashboard is where that stops: you write the question once, in a sentence, and the answer stays on a page you can open any morning.
Each answer on the page is a widget. You write the question in plain language, pick roughly how the answer should look, and an agent goes and works it out against your connected data, then draws the result.
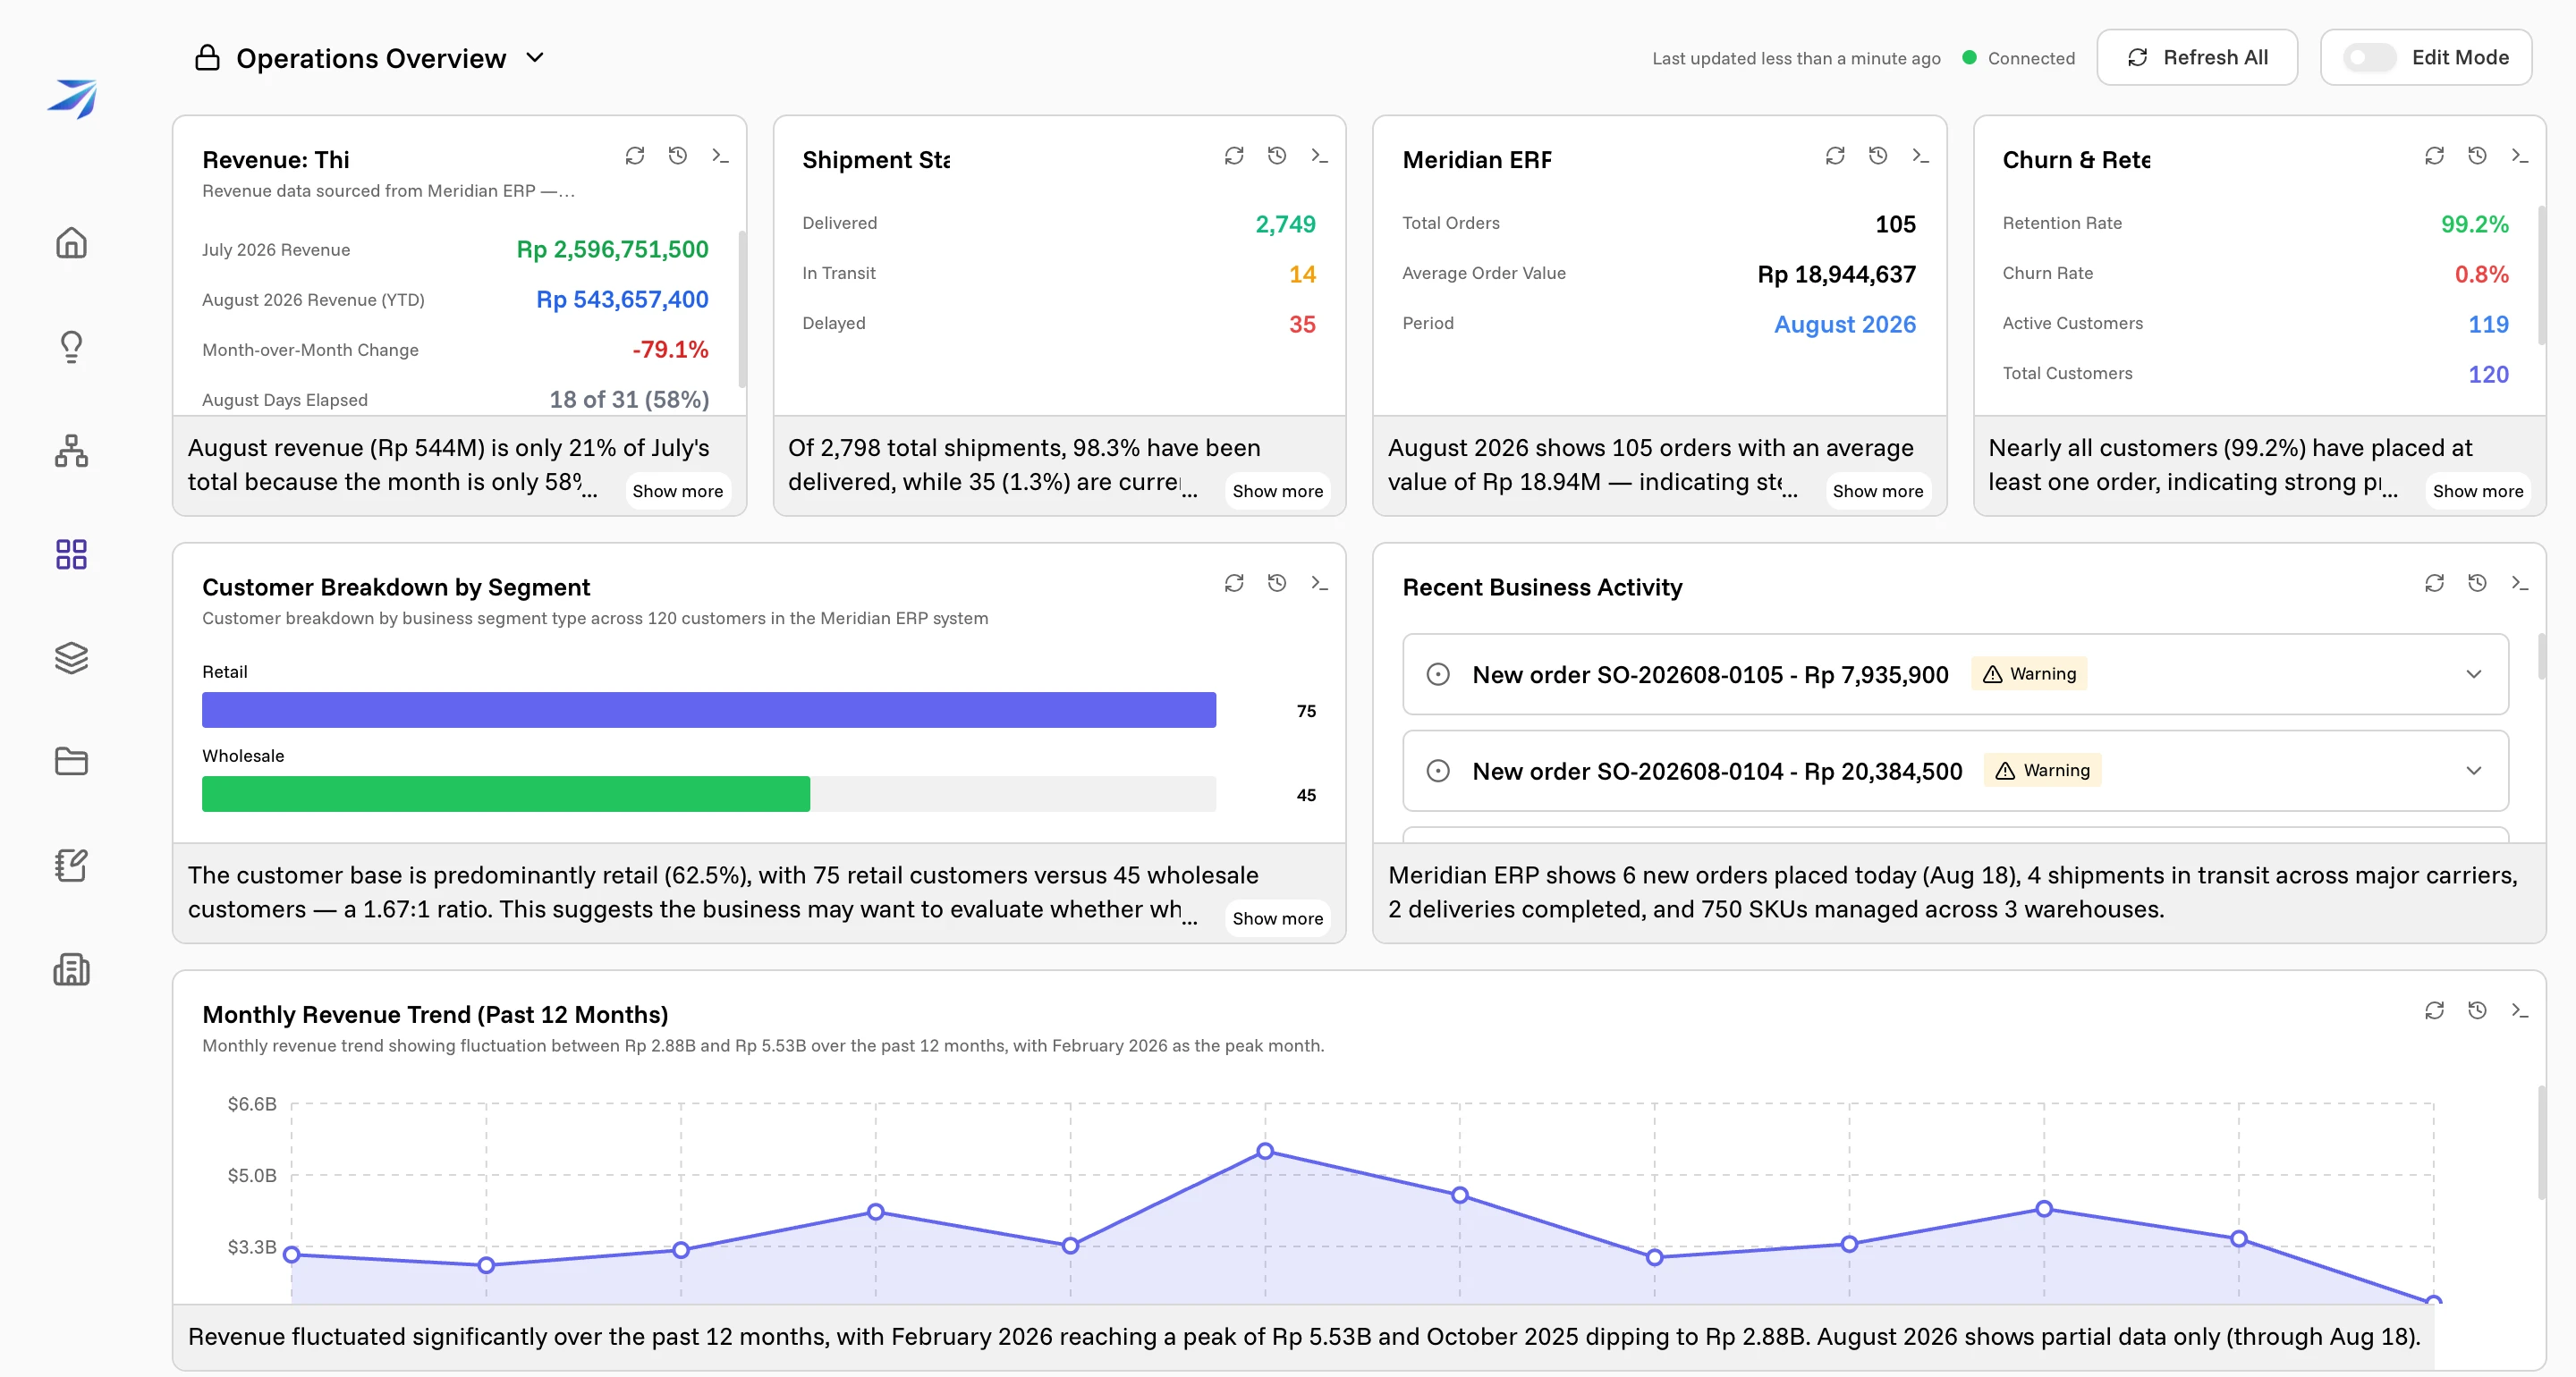
Every number on that page came from one sentence. "Shipment status breakdown from Meridian ERP: delivered, in transit, and delayed counts" produced the three counts, the colors, and the line underneath it — Of 2,798 total shipments, 98.3% have been delivered, while 35 (1.3%) are currently delayed and require attention.
What a widget can look at
The agent behind a widget reaches the same places Corint does, so a question can be about almost anything your organization has connected:
- Company data through Atlas — orders, inventory, customers, shipments, whatever your databases and business systems hold.
- Files in the Vault — a price list, a quarterly export, a contract.
- Workflows — what ran, what finished, what is waiting on a person.
Ask for something your organization has not connected and the widget says so rather than inventing a figure.
Dashboard or workflow?
A dashboard's job is to display where things stand — not to run your work. When a task needs doing — checking a supplier, compiling and sending a report, waiting on an approval — that's a workflow, which keeps a full record of every run. The two are meant to chain: let a workflow do the work, then point a widget at its runs so the outcome lands next to your other numbers.
Seeing how an answer was reached
You should be able to check any number a widget gives you. Every widget keeps
its own working, and the >_ icon in the widget header opens it.
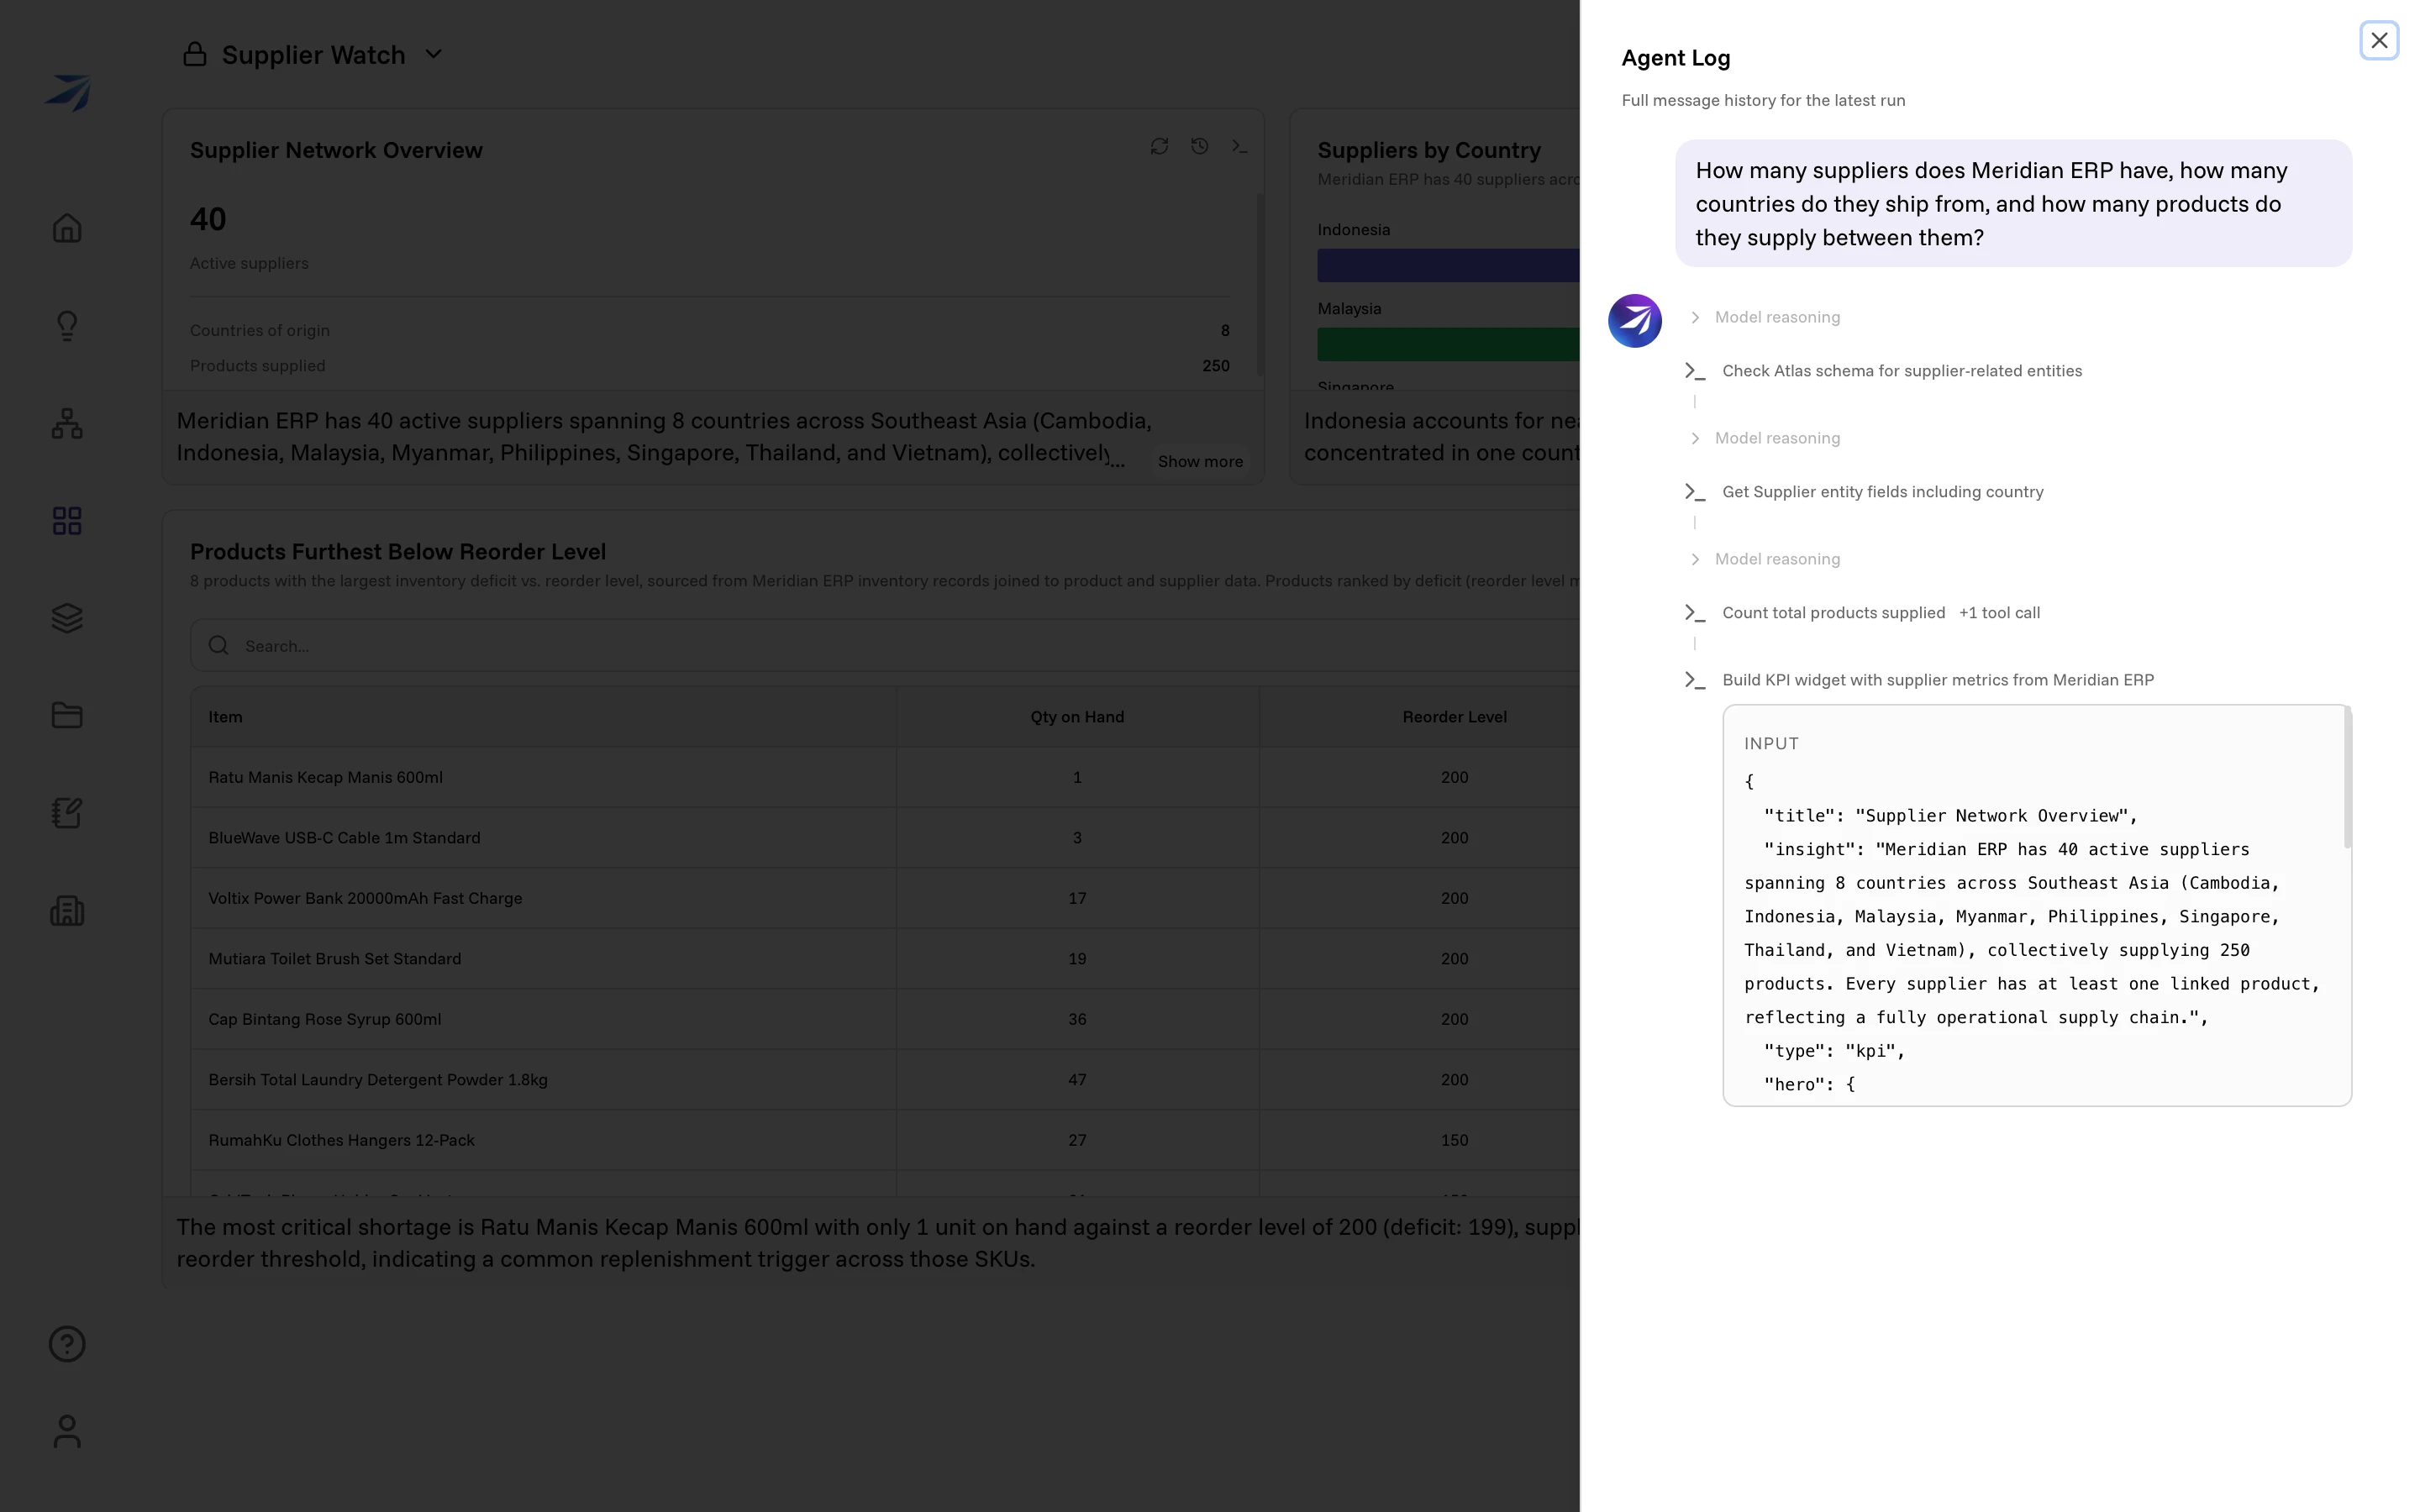
Agent Log — "Full message history for the latest run" — shows your prompt as it was sent, then every step the agent took: which entities it checked in Atlas, which fields it read, and the finished widget it handed back. When a figure looks wrong, this is where you find out why.
Next to it, the clock icon opens Run History: every past run of that widget, newest first, with the current one marked Latest. Click an older run and the widget shows what it said then, which is the quickest way to see whether a number moved or the question drifted. If a saved run uses a format the widget can no longer display, choose another run from the history menu.
When the numbers change
Widgets update when someone asks them to.
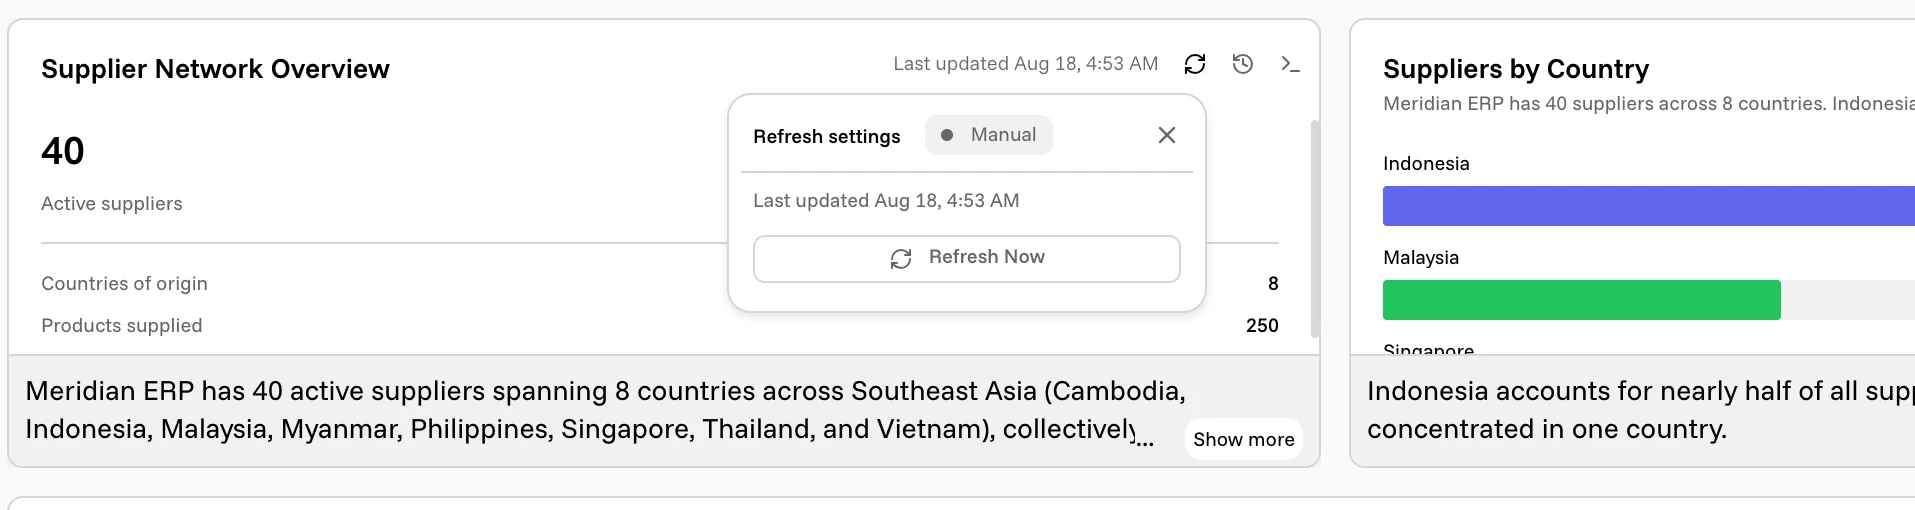
The circular-arrow icon on a widget opens Refresh settings, which shows a Manual badge, when the widget last ran, and a Refresh Now button that re-runs just that one. Refresh All in the top-right runs every widget on the page — the usual move when you open a dashboard you have not looked at in a week.
One thing worth knowing in advance: a dashboard started from a template arrives with its widgets written but not yet run. They read No data yet — click ⟳ to refresh until you press Refresh All once.
How the page is arranged
A dashboard is a four-column grid. Widgets occupy one to four columns and one or more rows, and rows stack down the page. In normal viewing there is nothing to manage — empty slots stay hidden, and you just read.
Turn on Edit Mode (top right) and the structure appears: every empty slot shows a +, each widget grows a drag handle and a resize corner, and a Compact button appears to pull everything up and close the gaps. A wide table wants four columns and two rows; a single figure is happy in one. The builder chat can rearrange all of it for you if you would rather describe the layout than drag it.
Dashboards are private to you until you share them, and sharing is per dashboard — named people, your whole organization, or anyone with the link.