Your first dashboard!
Build a three-widget dashboard from scratch, ask each widget a question in plain language, and read the answers.
This page builds a real dashboard called Supplier Overview — three widgets that answer, between them, who supplies this company, where those suppliers are, and what is about to run out. Nothing is configured; each widget is one sentence you type. It takes about ten minutes, most of which is the agents working.
The screenshots come from Meridian Distribution, a fictional goods distributor we use throughout these guides. Its ERP database is connected to Atlas, so questions about orders, suppliers, and stock have somewhere to land.
Create the dashboard
Click Dashboards in the left navigation, then New Dashboard. Two routes open:
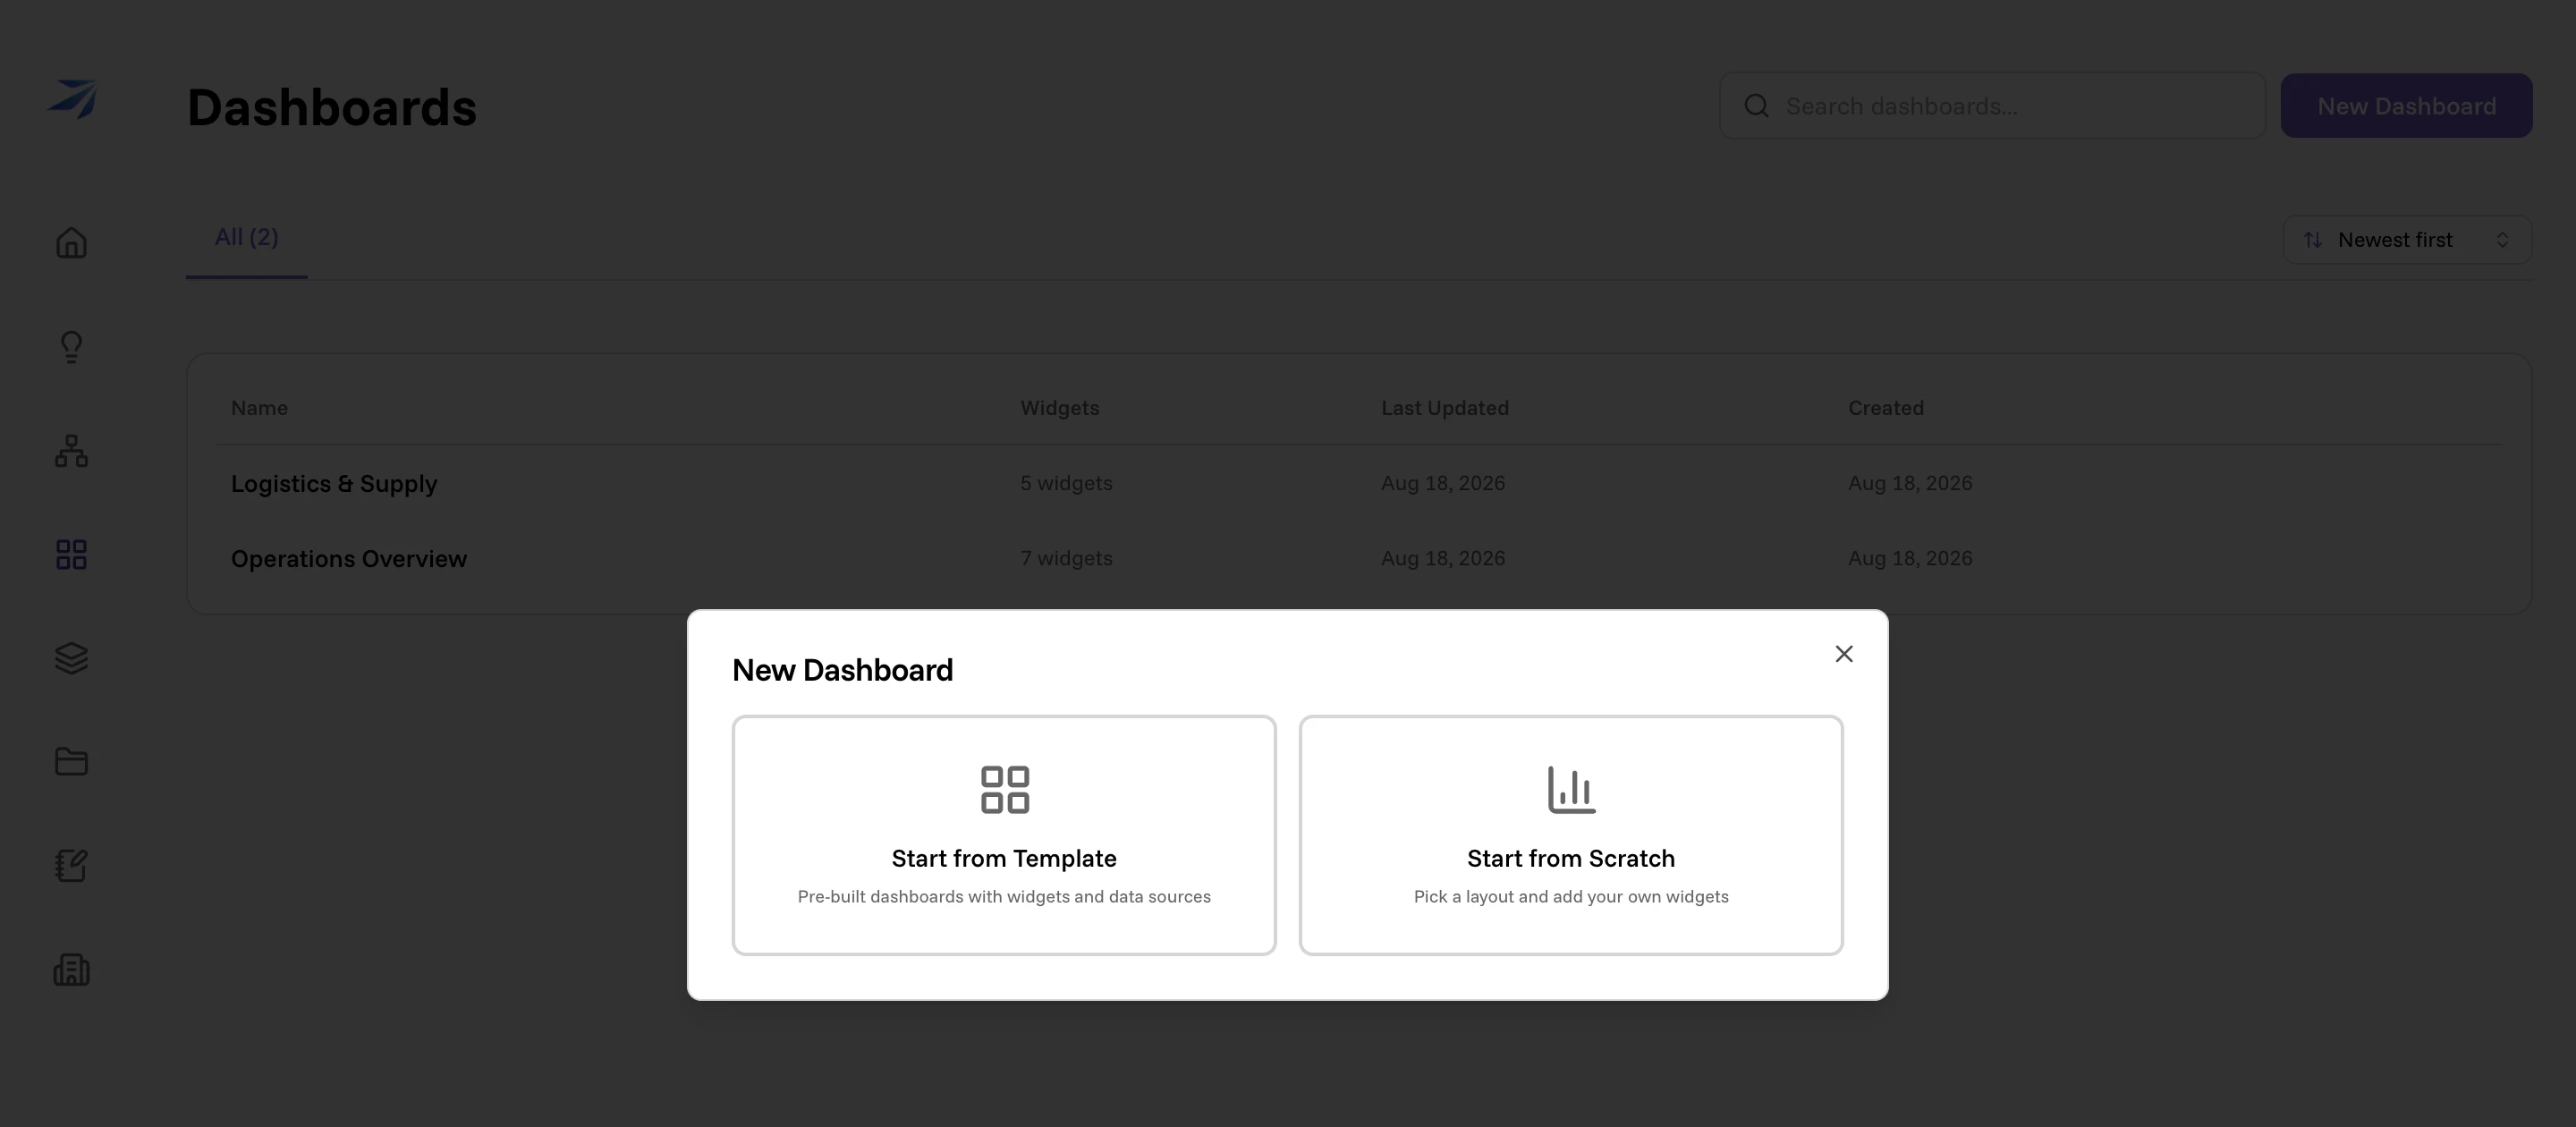
Start from Template hands you a ready-made set of widgets — Business Overview, Sales Pipeline, Engineering Metrics, Marketing Dashboard, or Financial Summary — with the questions already written. It is the fastest way to see a populated dashboard, and you can rewrite any of its prompts afterwards.
We are building by hand, so choose Start from Scratch.
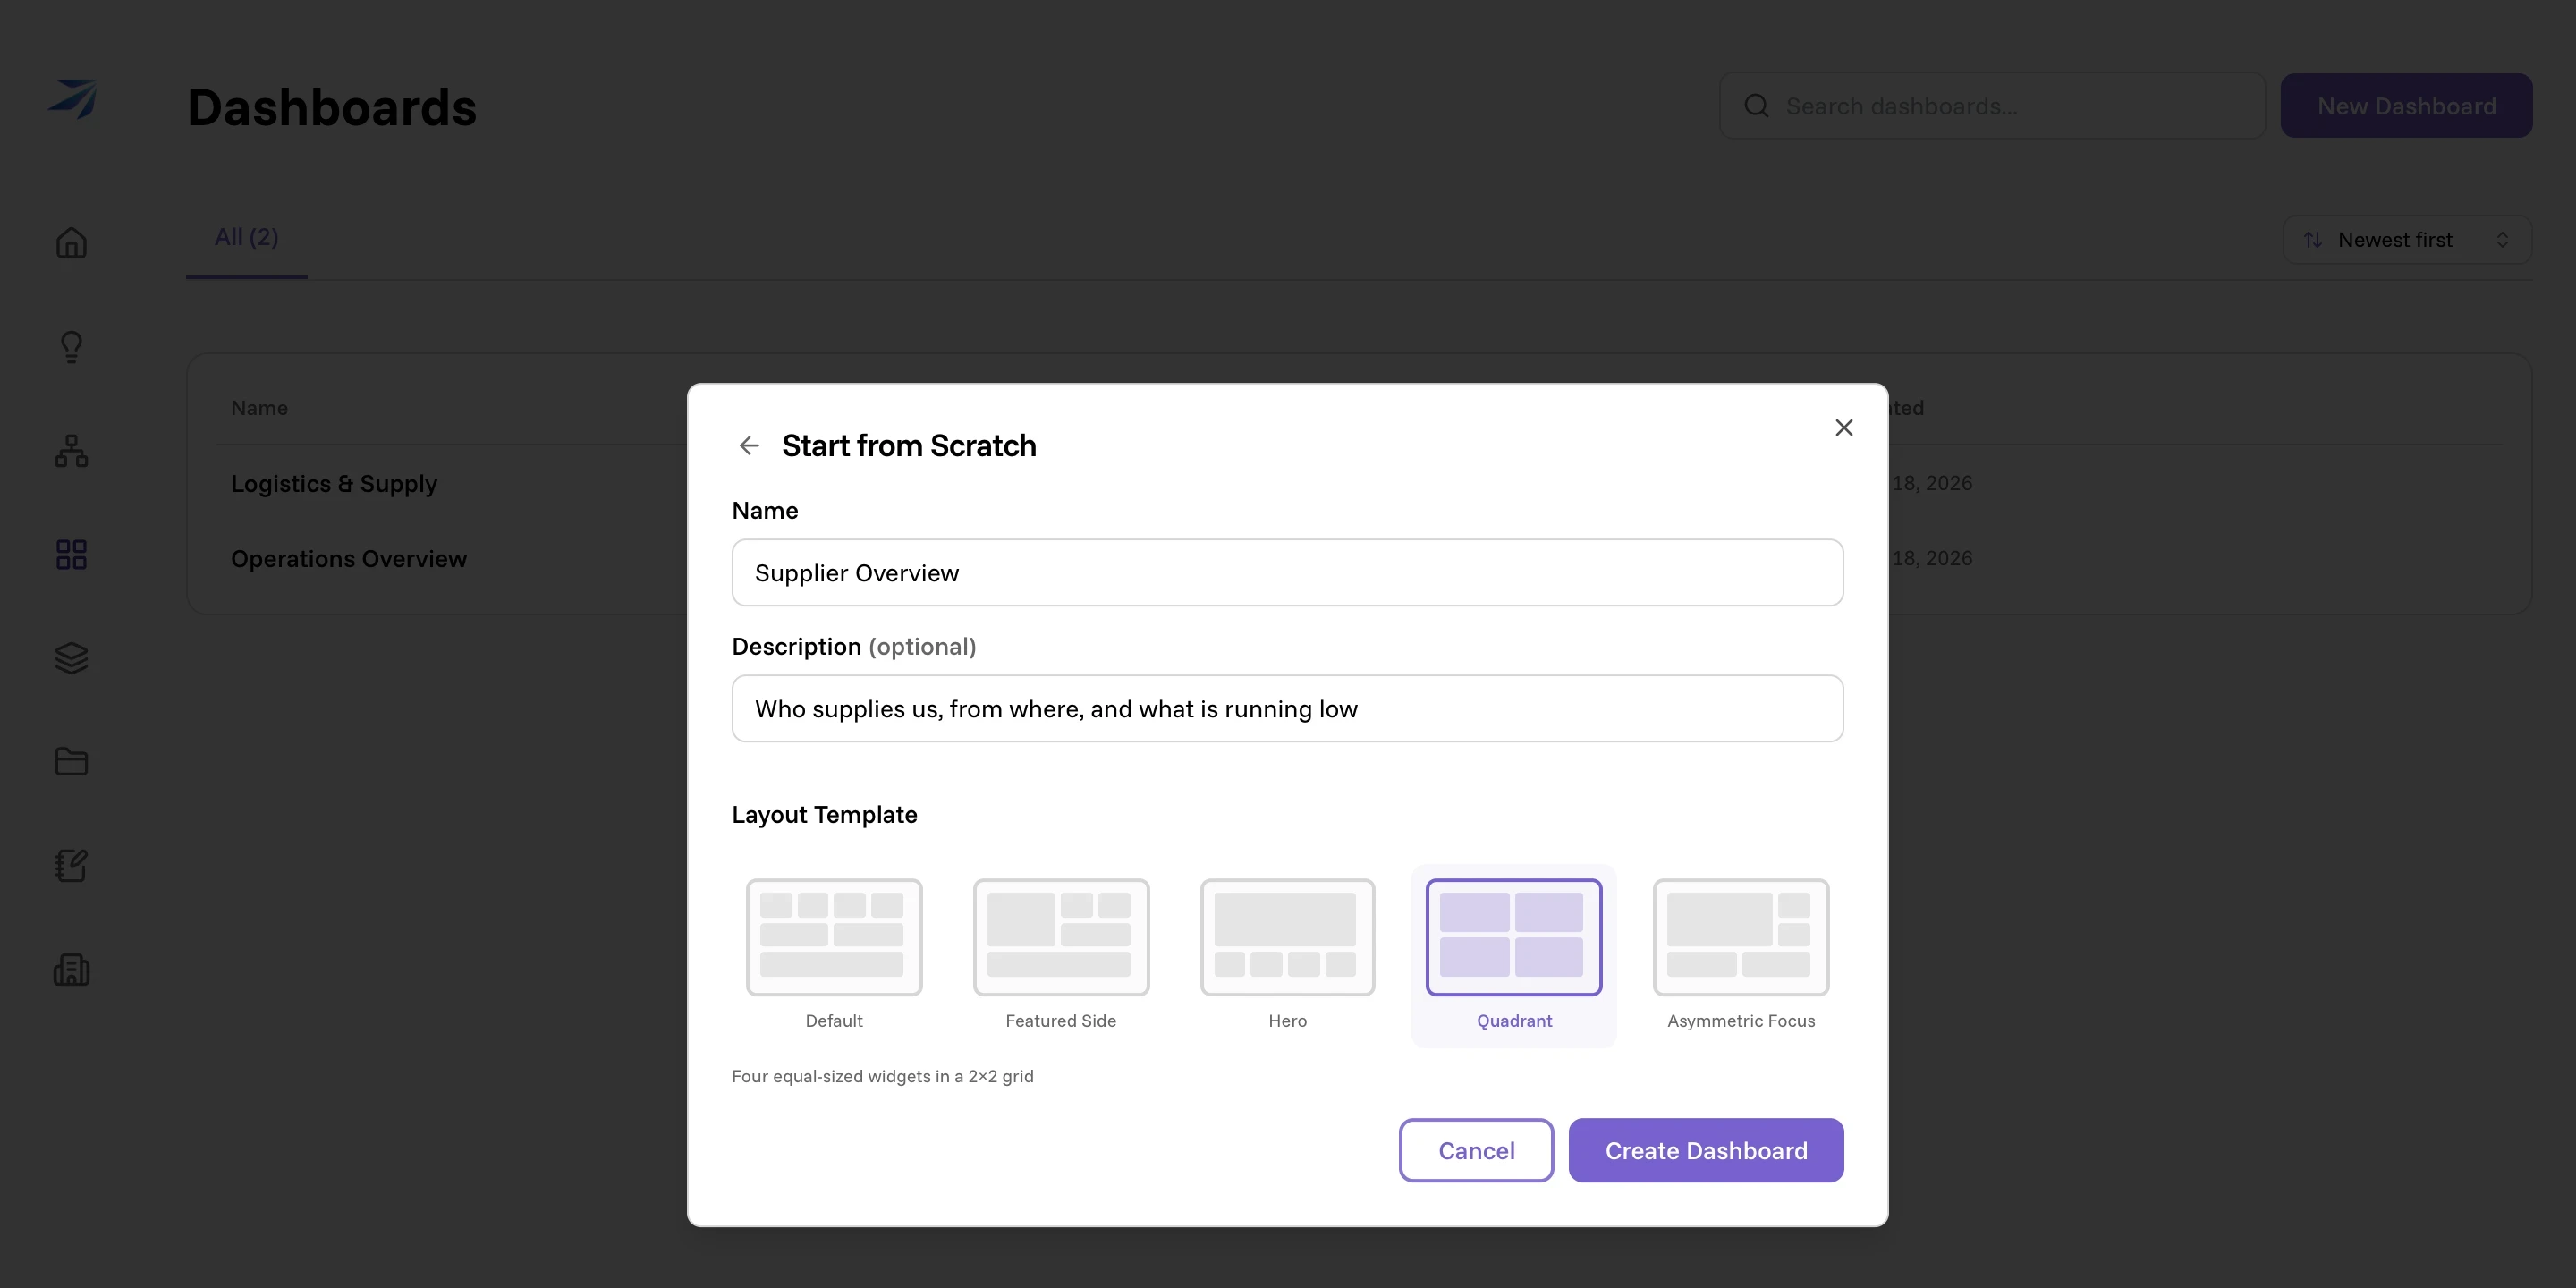
Name it Supplier Overview, and describe it as
Who supplies us, from where, and what is running low. Then pick a Layout
Template — the five options differ only in how the grid is carved up, and the
line under them explains each one. Quadrant gives "four equal-sized widgets
in a 2×2 grid", which suits three widgets fine. Click Create Dashboard.
Add the first widget
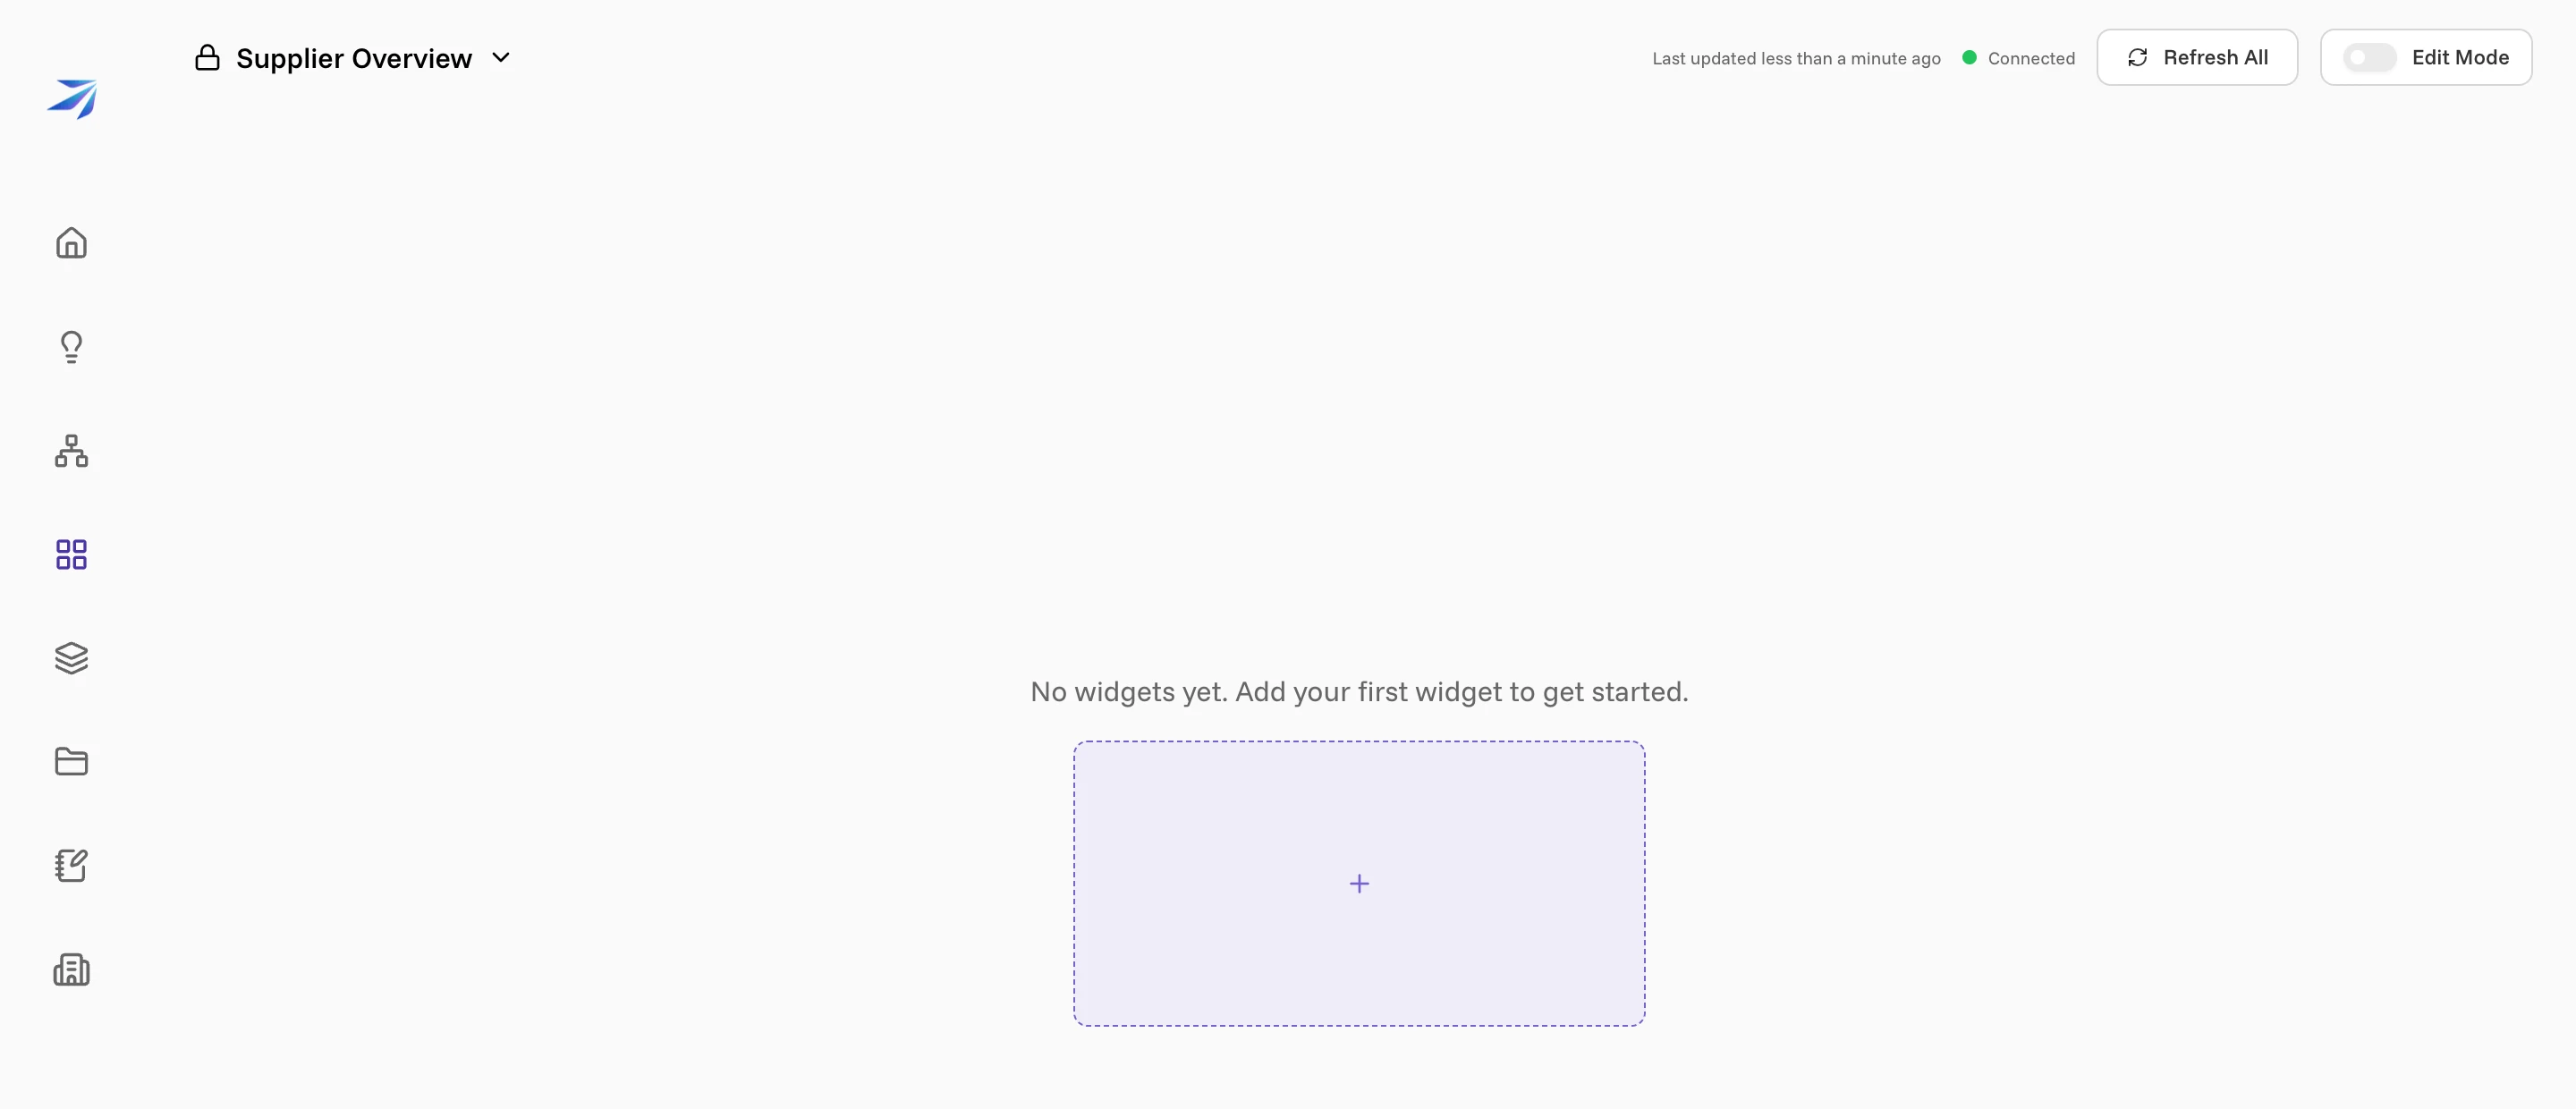
The new dashboard is empty: No widgets yet. Add your first widget to get started. with a single dashed slot underneath.
Click the +. Two things happen: Edit Mode switches on, revealing the four slots of the Quadrant layout, and the Edit Widget dialog opens on top.
Ask the first question
The dialog has two halves. On the right you choose a Widget type and write a Prompt. On the left sits an example of the type you picked, greyed out and labeled Example — it shows the shape of the answer, not your data.
Leave the type as KPI Card and write the prompt:
How many suppliers does Meridian ERP have, how many countries do they ship from, and how many products do they supply between them?
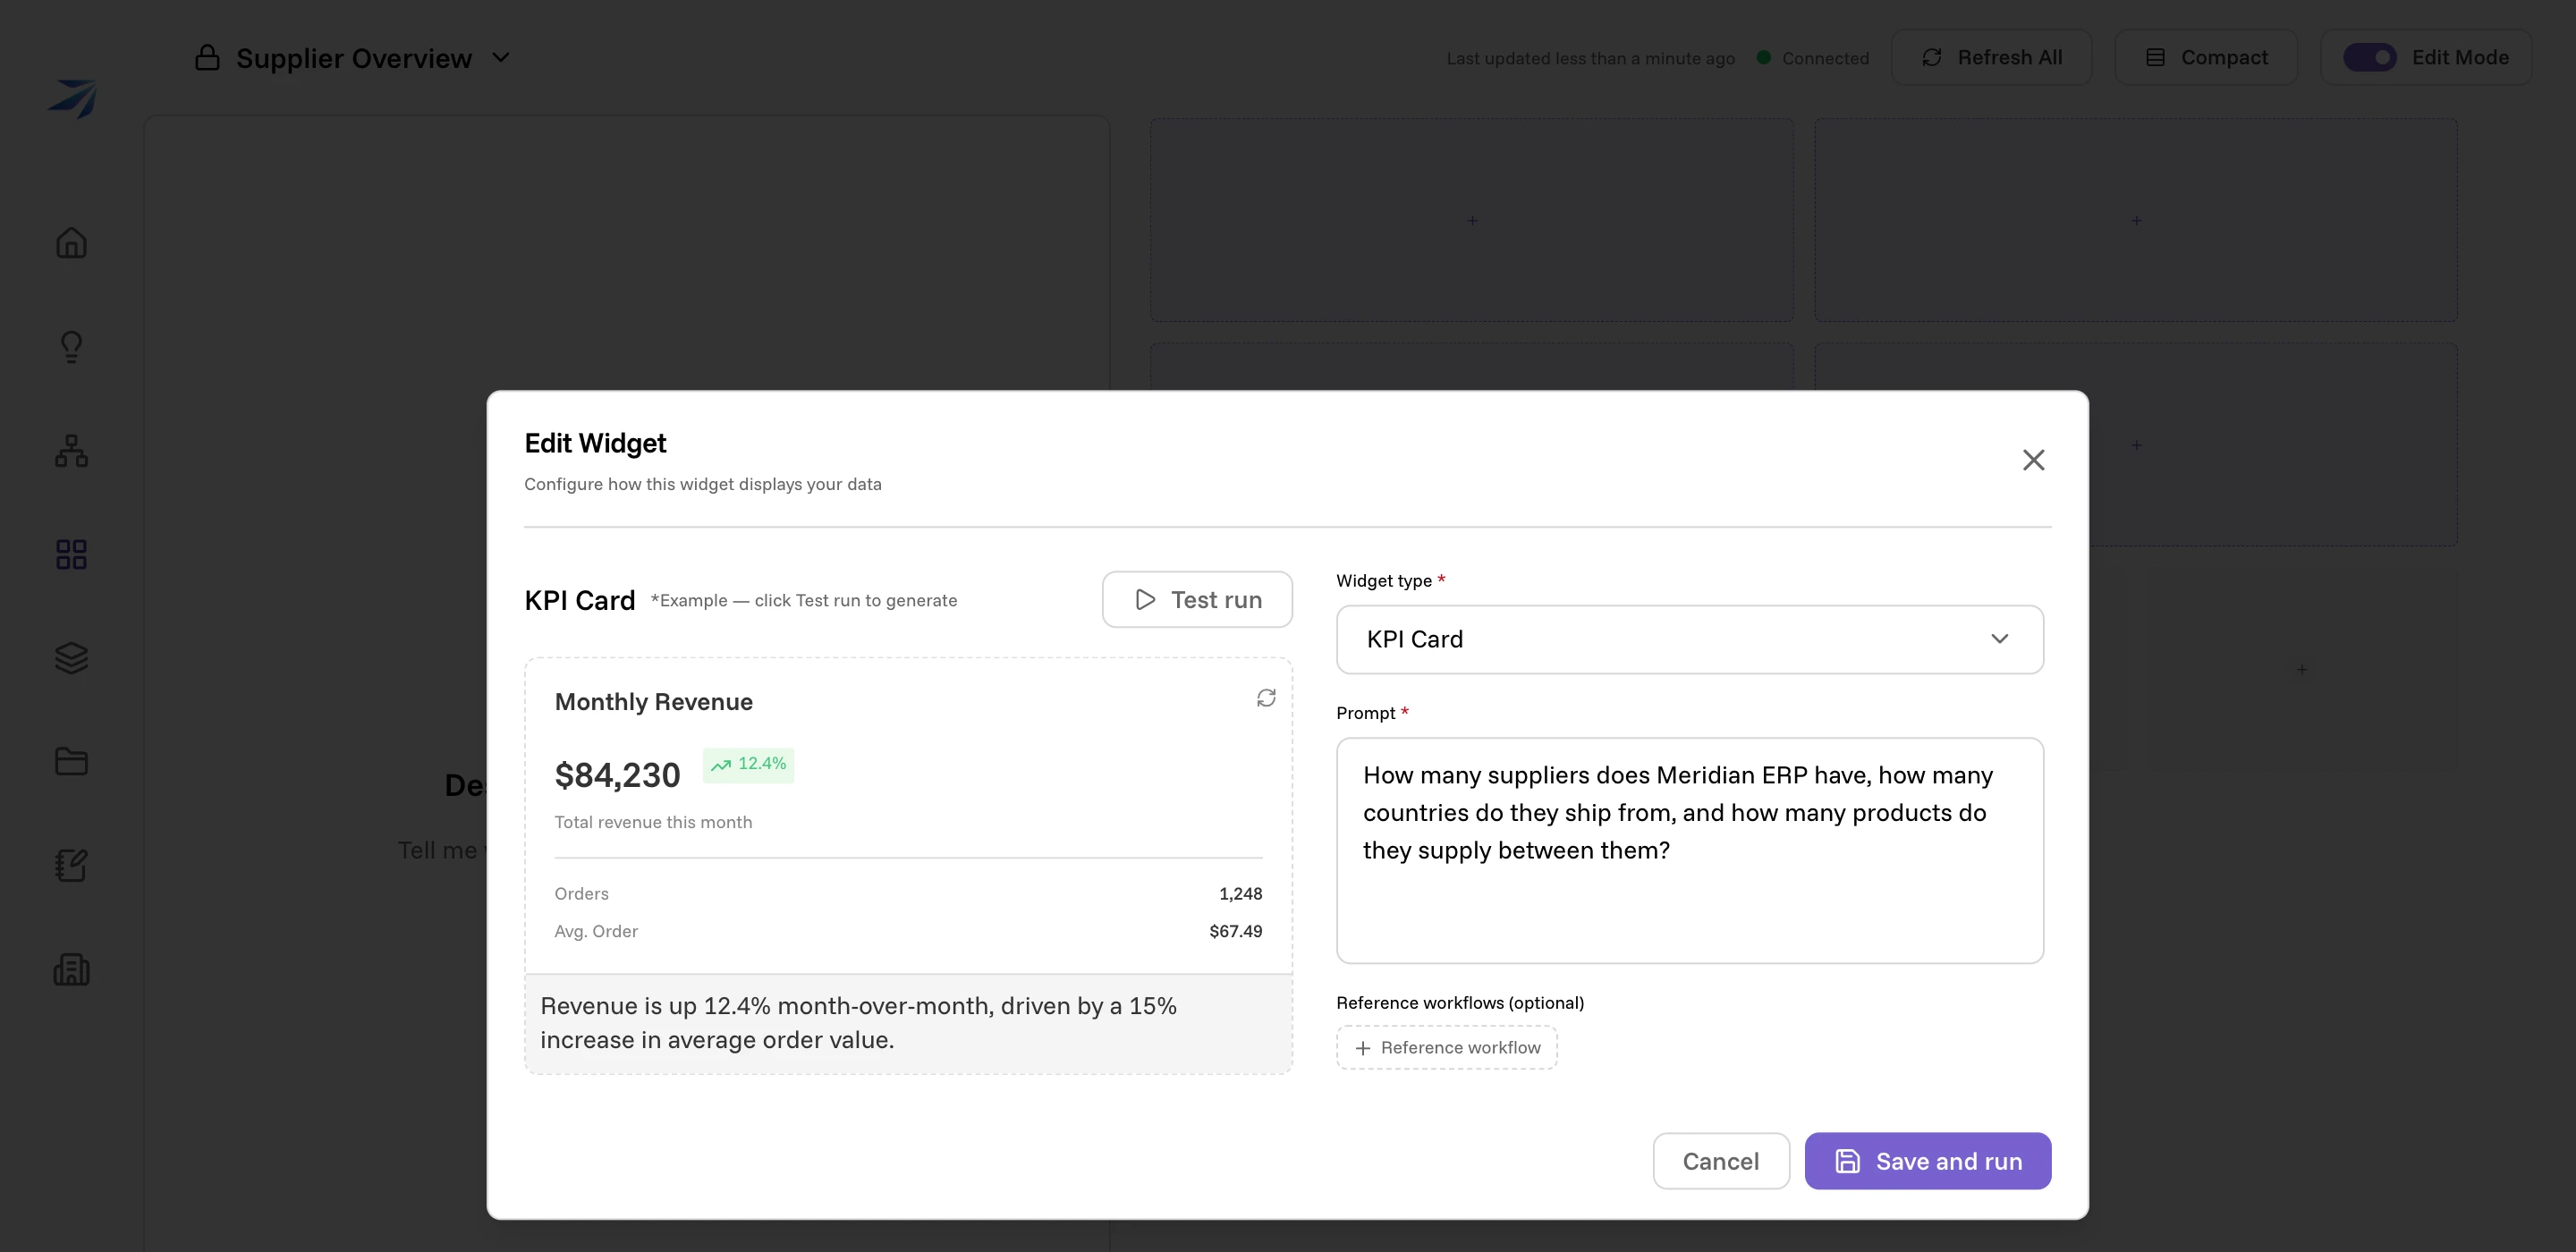
Write it the way you would ask a colleague. Naming the source — Meridian ERP — saves the agent a guess when several systems are connected.
Click Save and run. The widget lands in the first slot and starts working: it looks through the Atlas entities, finds the ones about suppliers and products, counts, and comes back with 40 active suppliers, 8 countries, 250 products.
Change the type for the second question
Click the + in the next slot. This time open the Widget type selector at the top right of the dialog.
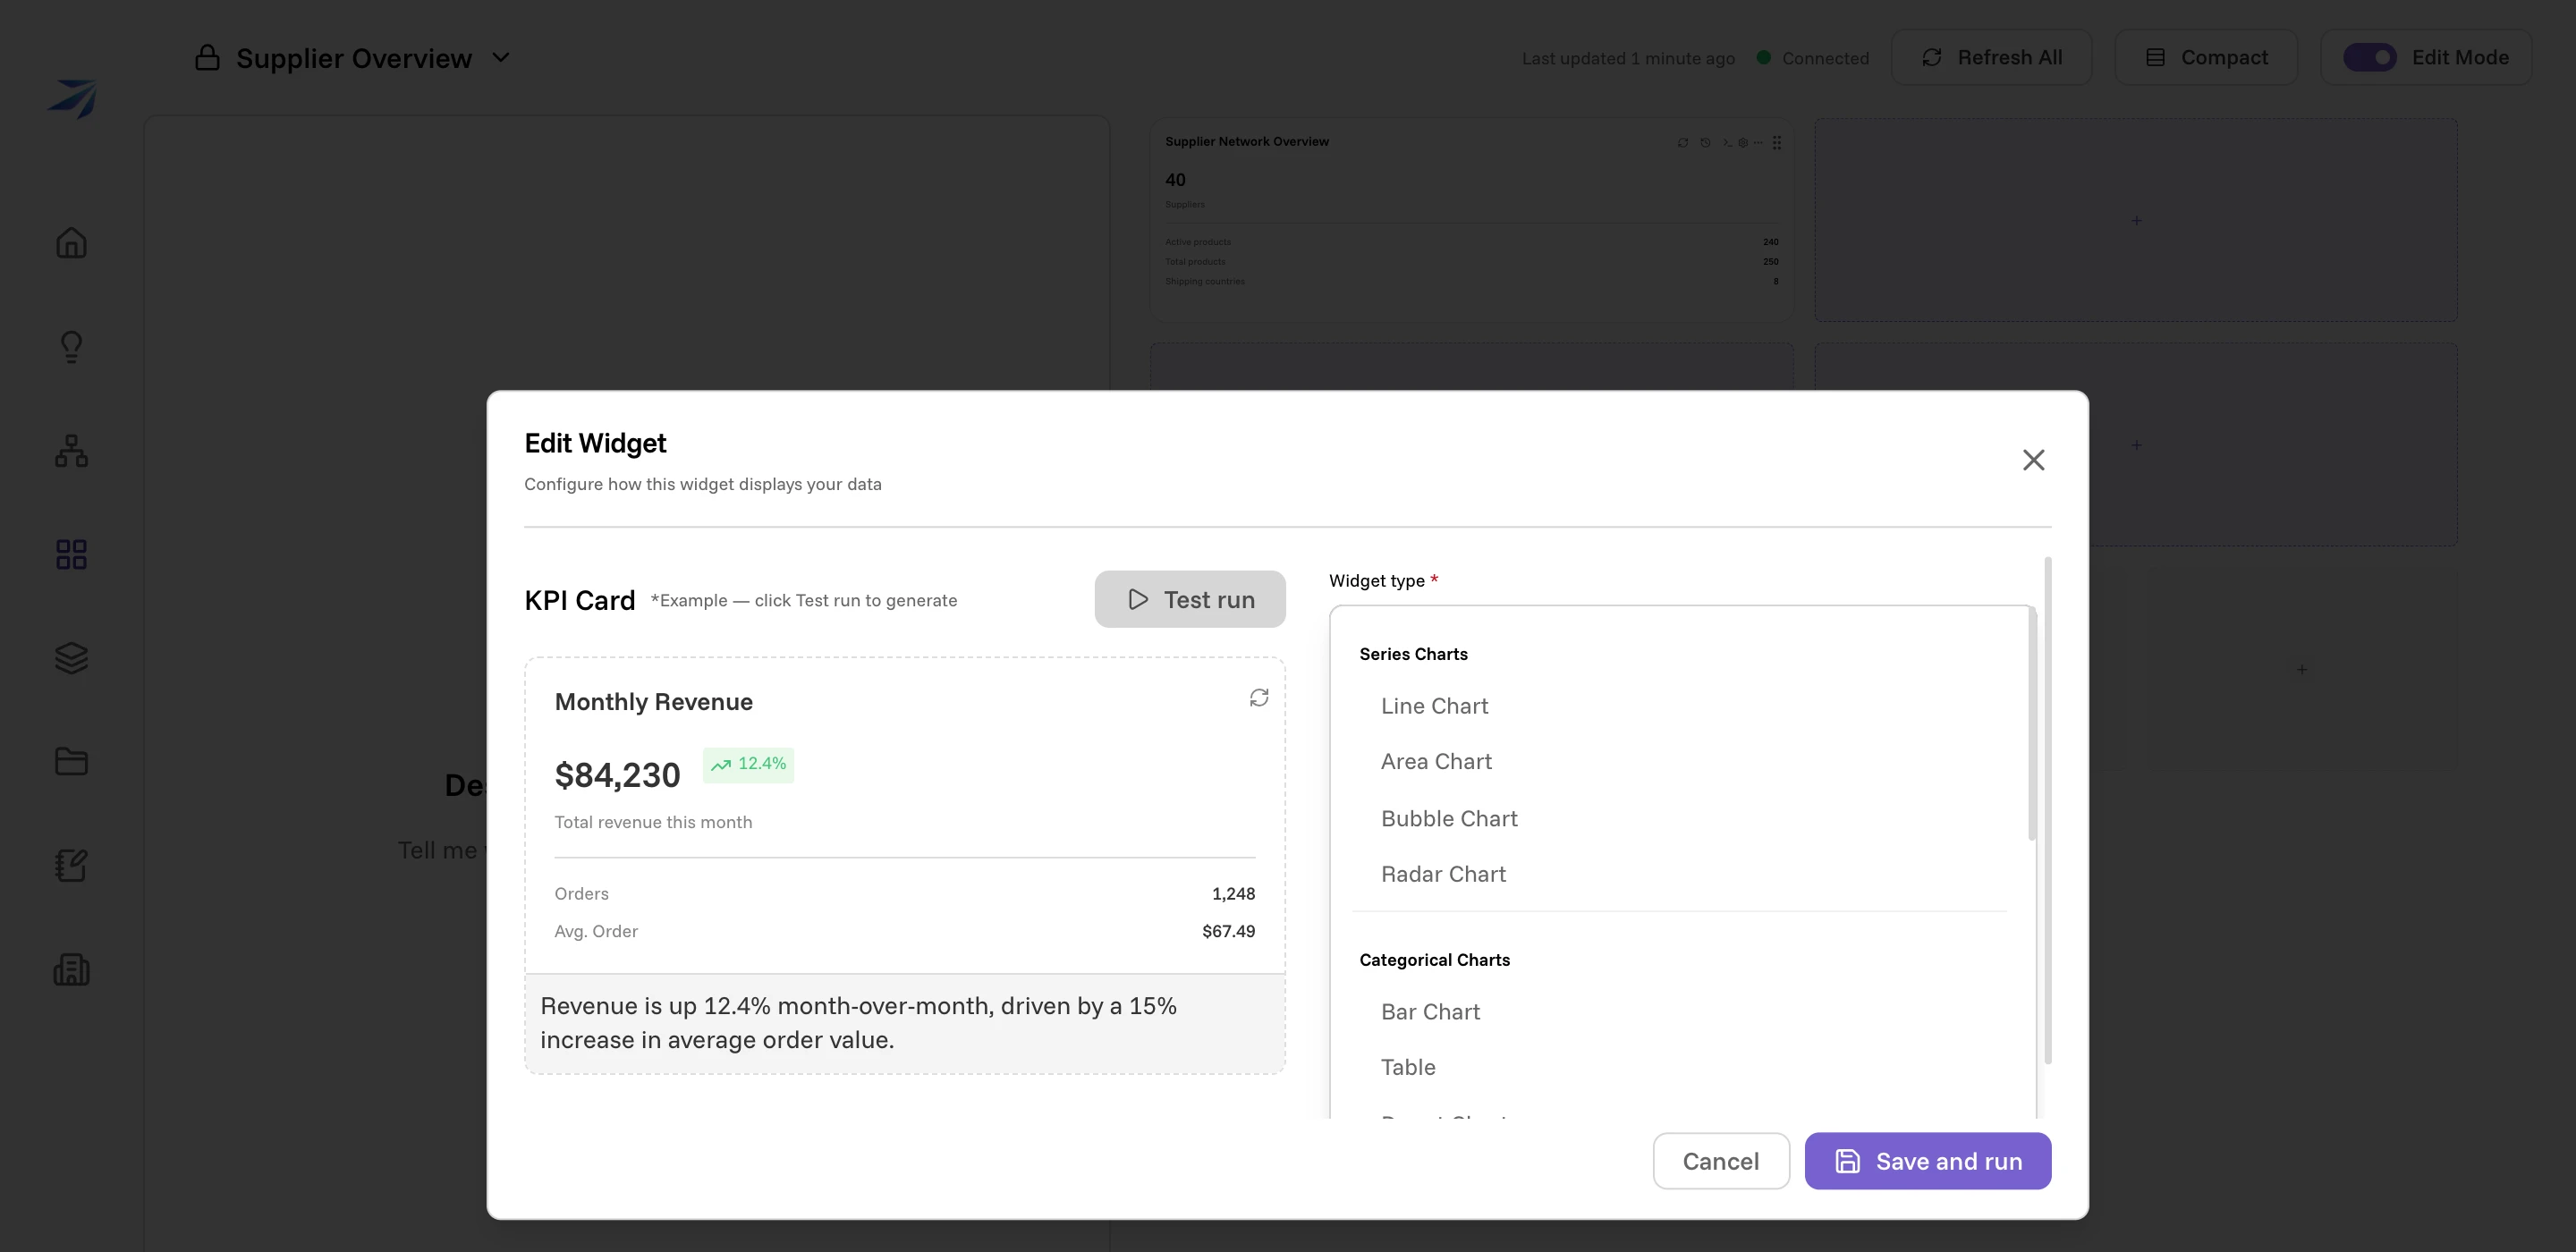
The list holds twenty-nine types. Thirteen of them sit under three labels — Series Charts, Categorical Charts, and Actions — and the other sixteen follow as a plain list underneath; Widget types walks through all of them. Pick Bar Chart and ask:
Number of suppliers by country in Meridian ERP, largest first
Then add a third widget as a Table:
The eight products furthest below their reorder level in Meridian ERP, with quantity on hand, reorder level, and the supplier that provides each one
Each one saves and runs on its own; you do not have to wait for one before starting the next.
Give the table room
A table with four columns in a quarter-page slot is a table nobody reads. While Edit Mode is still on, grab the corner of the table widget and drag it out to the full width of the grid.
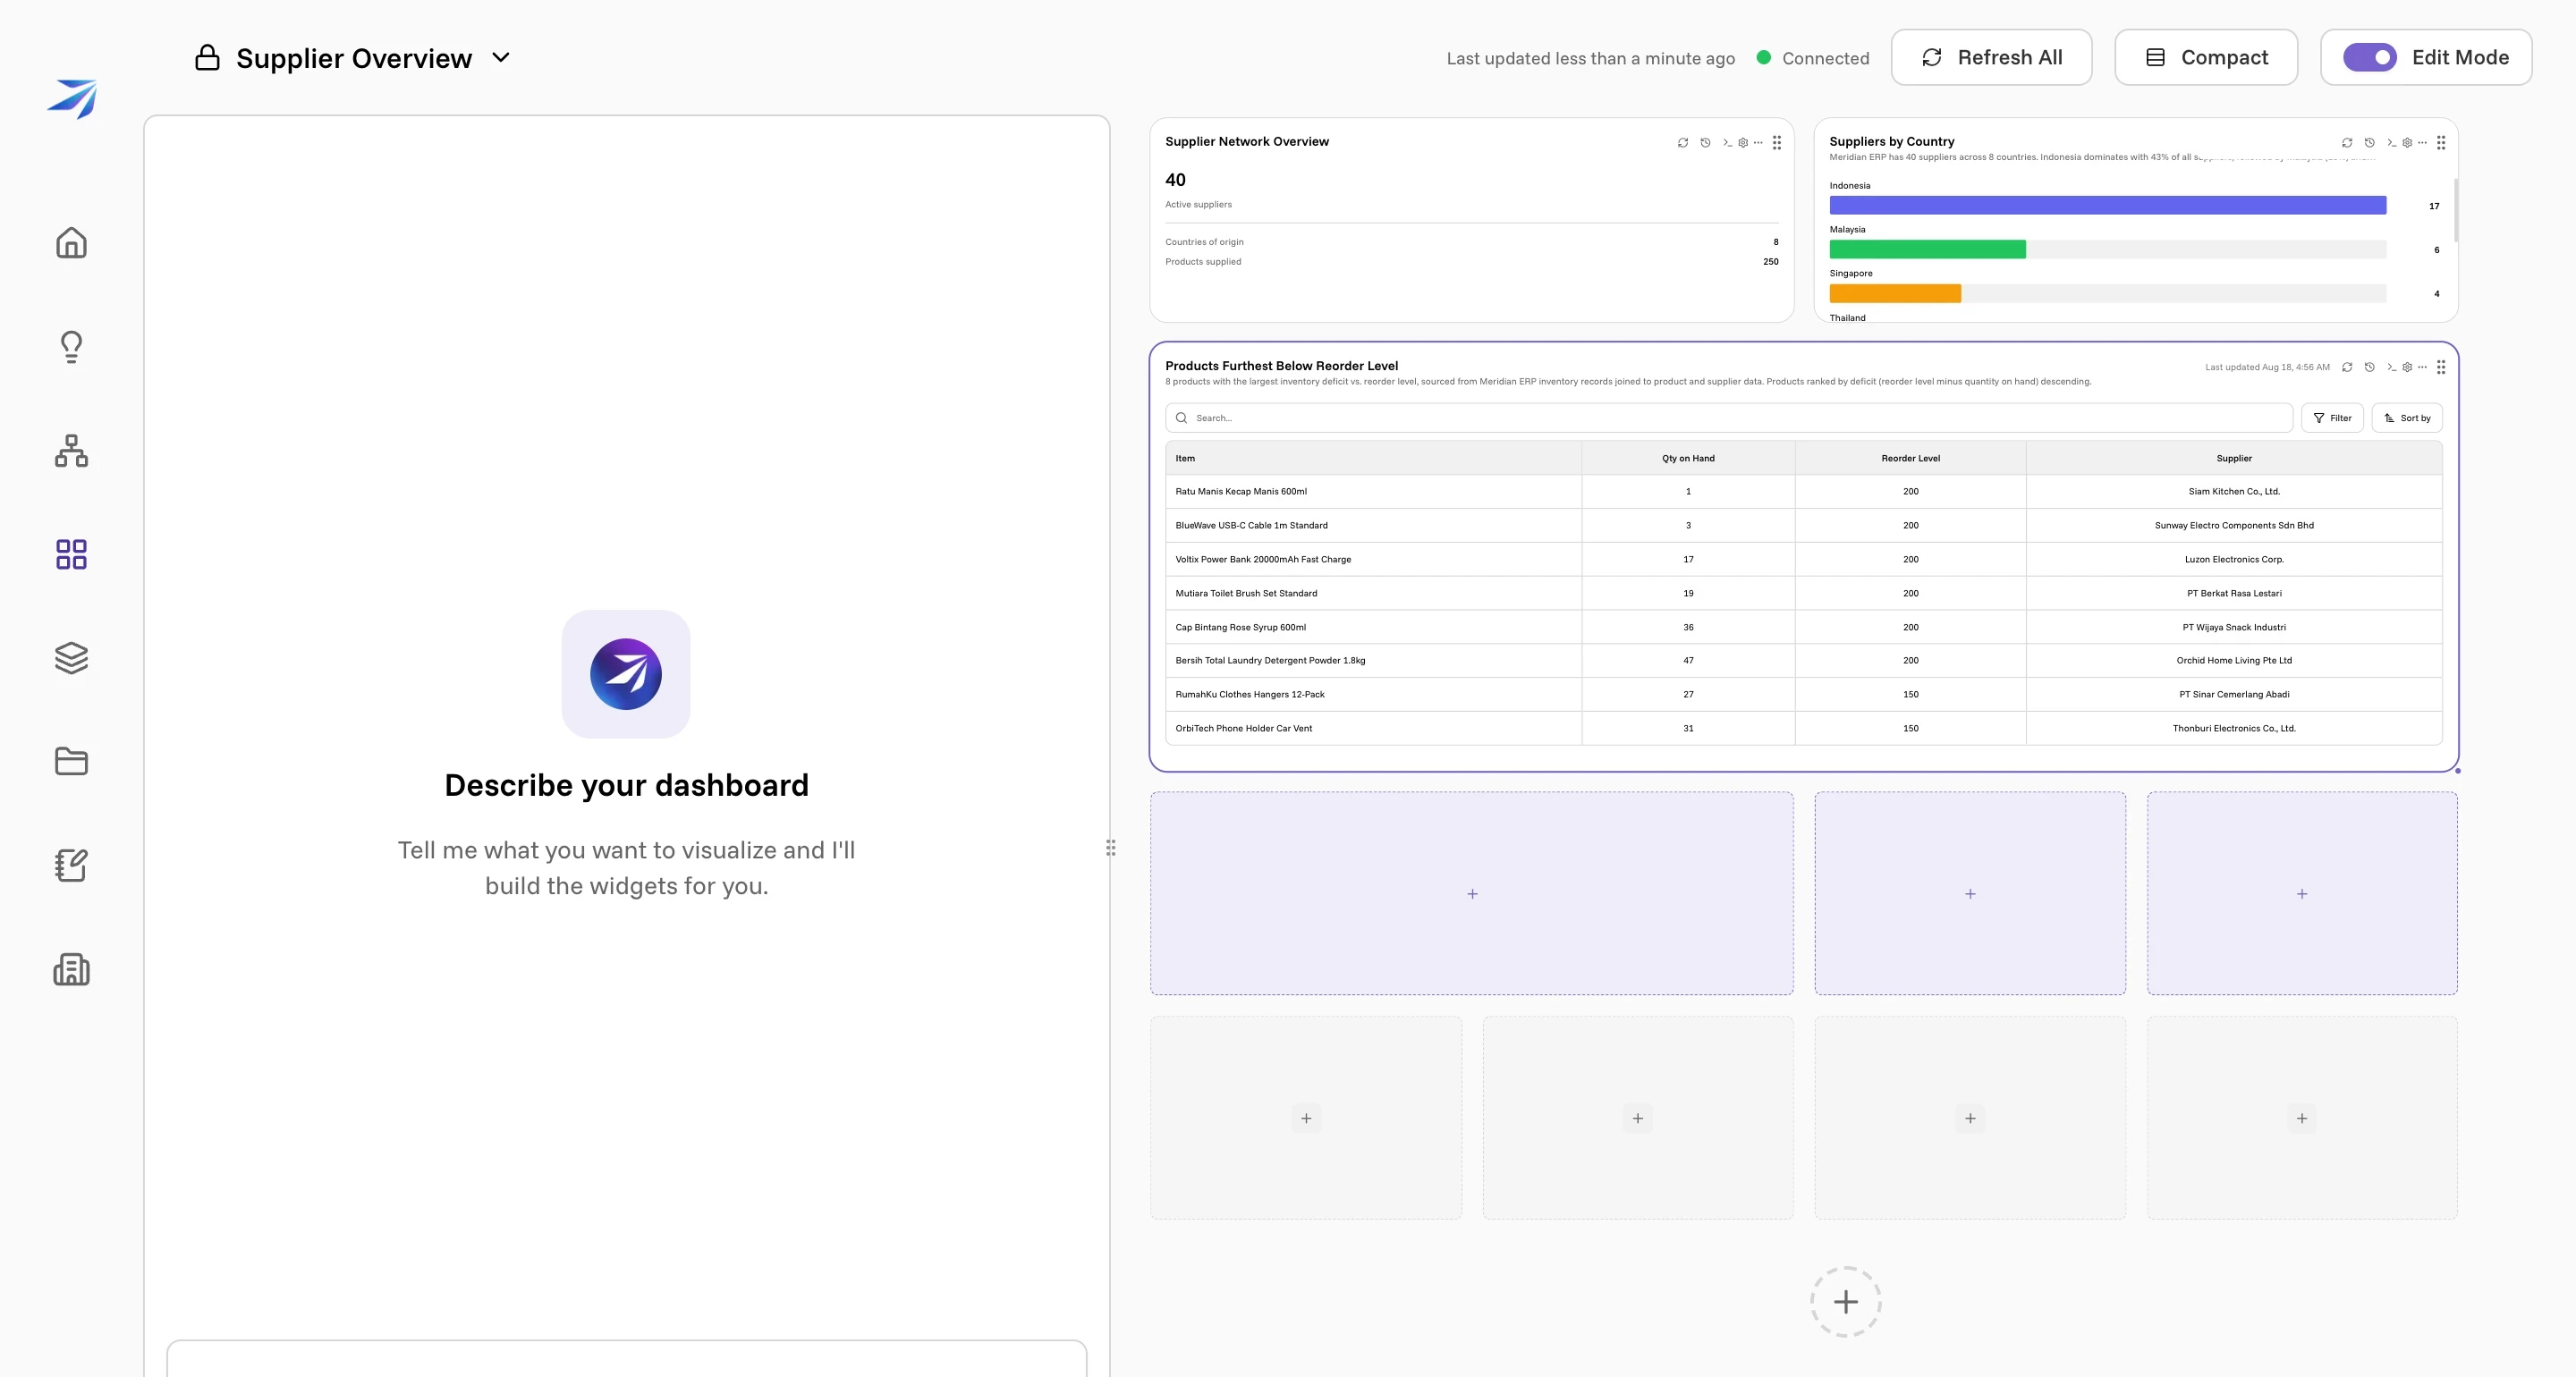
Widgets snap to the four-column grid as you drag, and the handle in the widget header moves it. Compact in the top bar pulls everything up and closes any gaps you leave behind.
Read what you built
Switch Edit Mode back off. The slots disappear and the dashboard is just the answers.
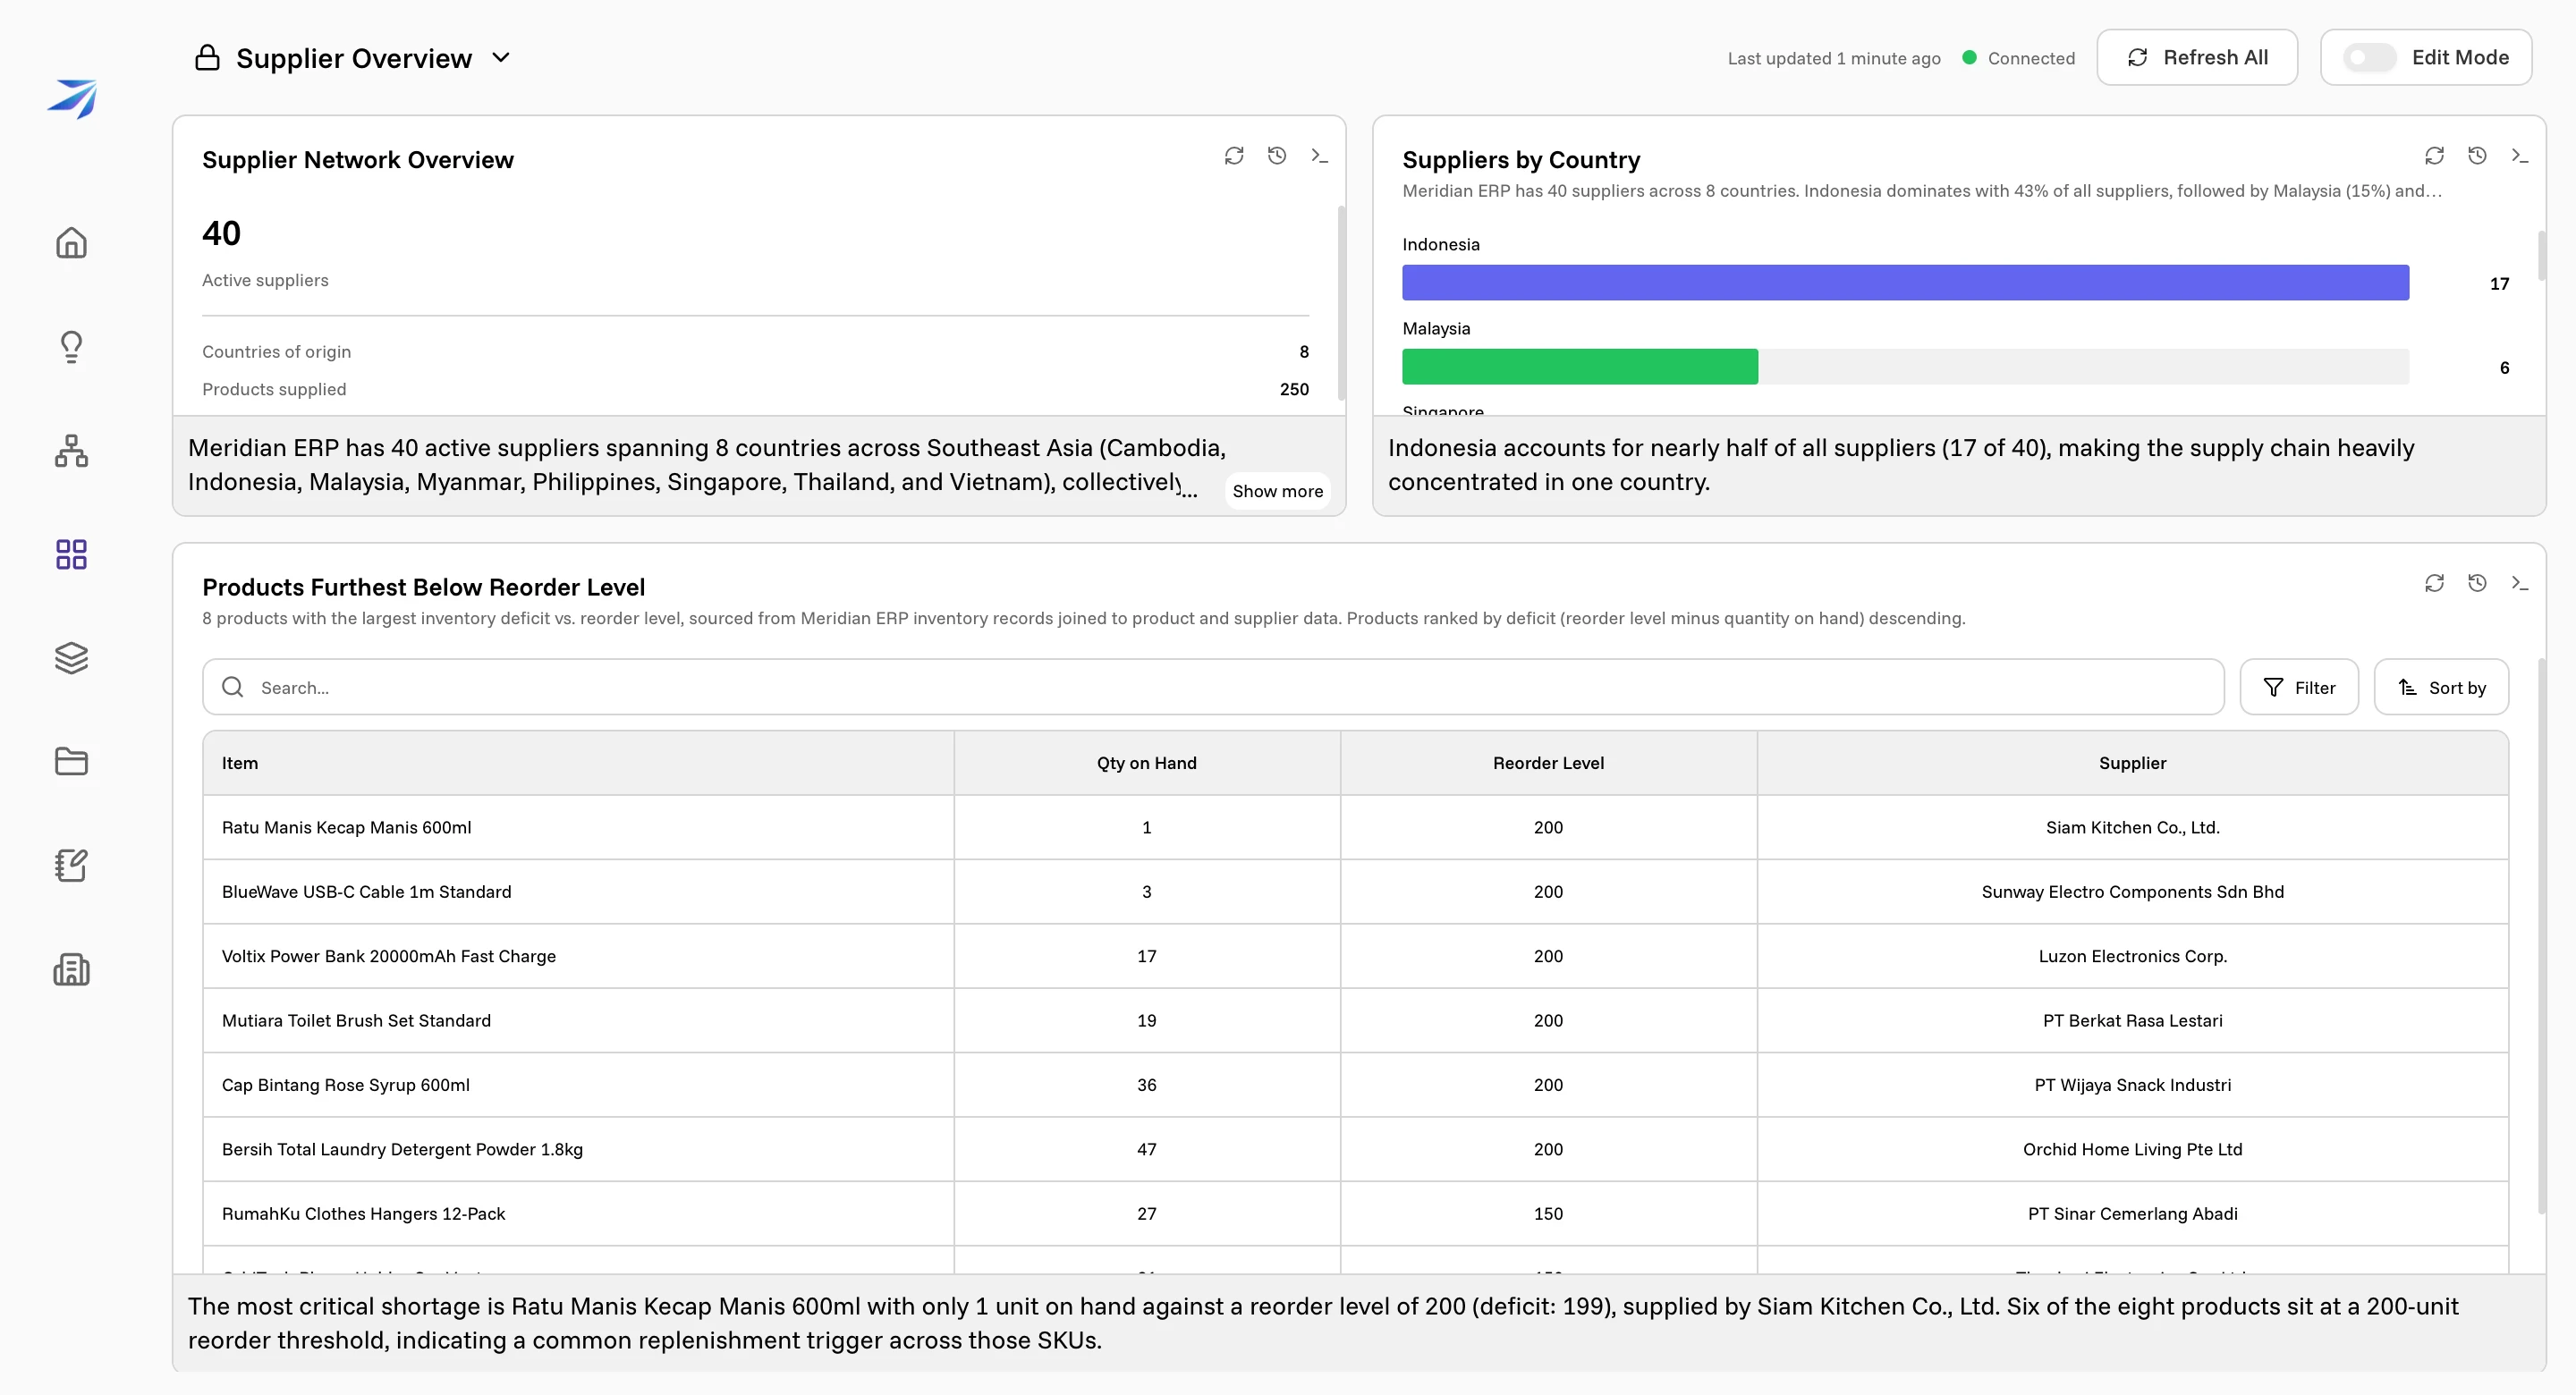
Under each widget is a line the agent wrote about its own result — Indonesia accounts for nearly half of all suppliers (17 of 40), making the supply chain heavily concentrated in one country.
Every row came out of the ERP: Ratu Manis Kecap Manis 600ml really is down to
one unit against a reorder level of 200, supplied by Siam Kitchen Co., Ltd. When
you want to be sure of a figure — or think one looks wrong — the >_ icon opens
the agent's working, query by query.
What you have now
Three questions that answer themselves. Open this page next month and press Refresh All, and the same three questions run again against whatever the data says then.