Atlas for power users
The atlas command line in the Desktop sandbox — schema, describe, count, query, agg and export, with the output it actually prints.
Ask Atlas and the query console answer questions.
The atlas command answers them in a shell, where you can pipe the result into
jq, loop over ten entities, or drop the output into a script that runs again
tomorrow. It's a read-only, typed surface: no SQL goes in, and nothing you type
can write to a source.
You get it in the Desktop sandbox — take control of
the terminal and it's on your PATH. It's also exactly what Corint runs when it
answers from your data, so anything on this page is something you can ask the
agent to run for you.
Every command prints JSON on stdout with one fixed shape. Keys are always
present, null when unknown. The outputs below are real, from a Postgres source
called Meridian ERP. They print as a single line — here they're wrapped for
reading, and where one is shortened, a … marks the cut.
The loop
schema → describe → count / query / agg. Skipping the middle step is
the usual way to waste a run: describe is what tells you a field's real name,
its type, and which conditions are legal on it.
atlas schema — what exists
$ atlas schema{"sources": [{"name": "Meridian ERP", "kind": "postgres", "status": "ok",
"error": null, "checkedAt": "2026-08-18T12:20:14.794Z",
"entities": 8, "lastDiscoveredAt": "2026-08-18T11:08:16.956Z"}],
"entities": [
{"name": "Customer", "source": "Meridian ERP", "group": "Sales & CRM", "rows": 120},
{"name": "InventoryItem", "source": "Meridian ERP", "group": "Inventory & Supply Chain", "rows": 750},
{"name": "OrderLineItem", "source": "Meridian ERP", "group": "Sales & CRM", "rows": 11107},
{"name": "SalesOrder", "source": "Meridian ERP", "group": "Sales & CRM", "rows": 3000},
{"name": "Shipment", "source": "Meridian ERP", "group": "Operations & Logistics", "rows": 2798},
…],
"total": 8, "matched": 8, "offset": 0}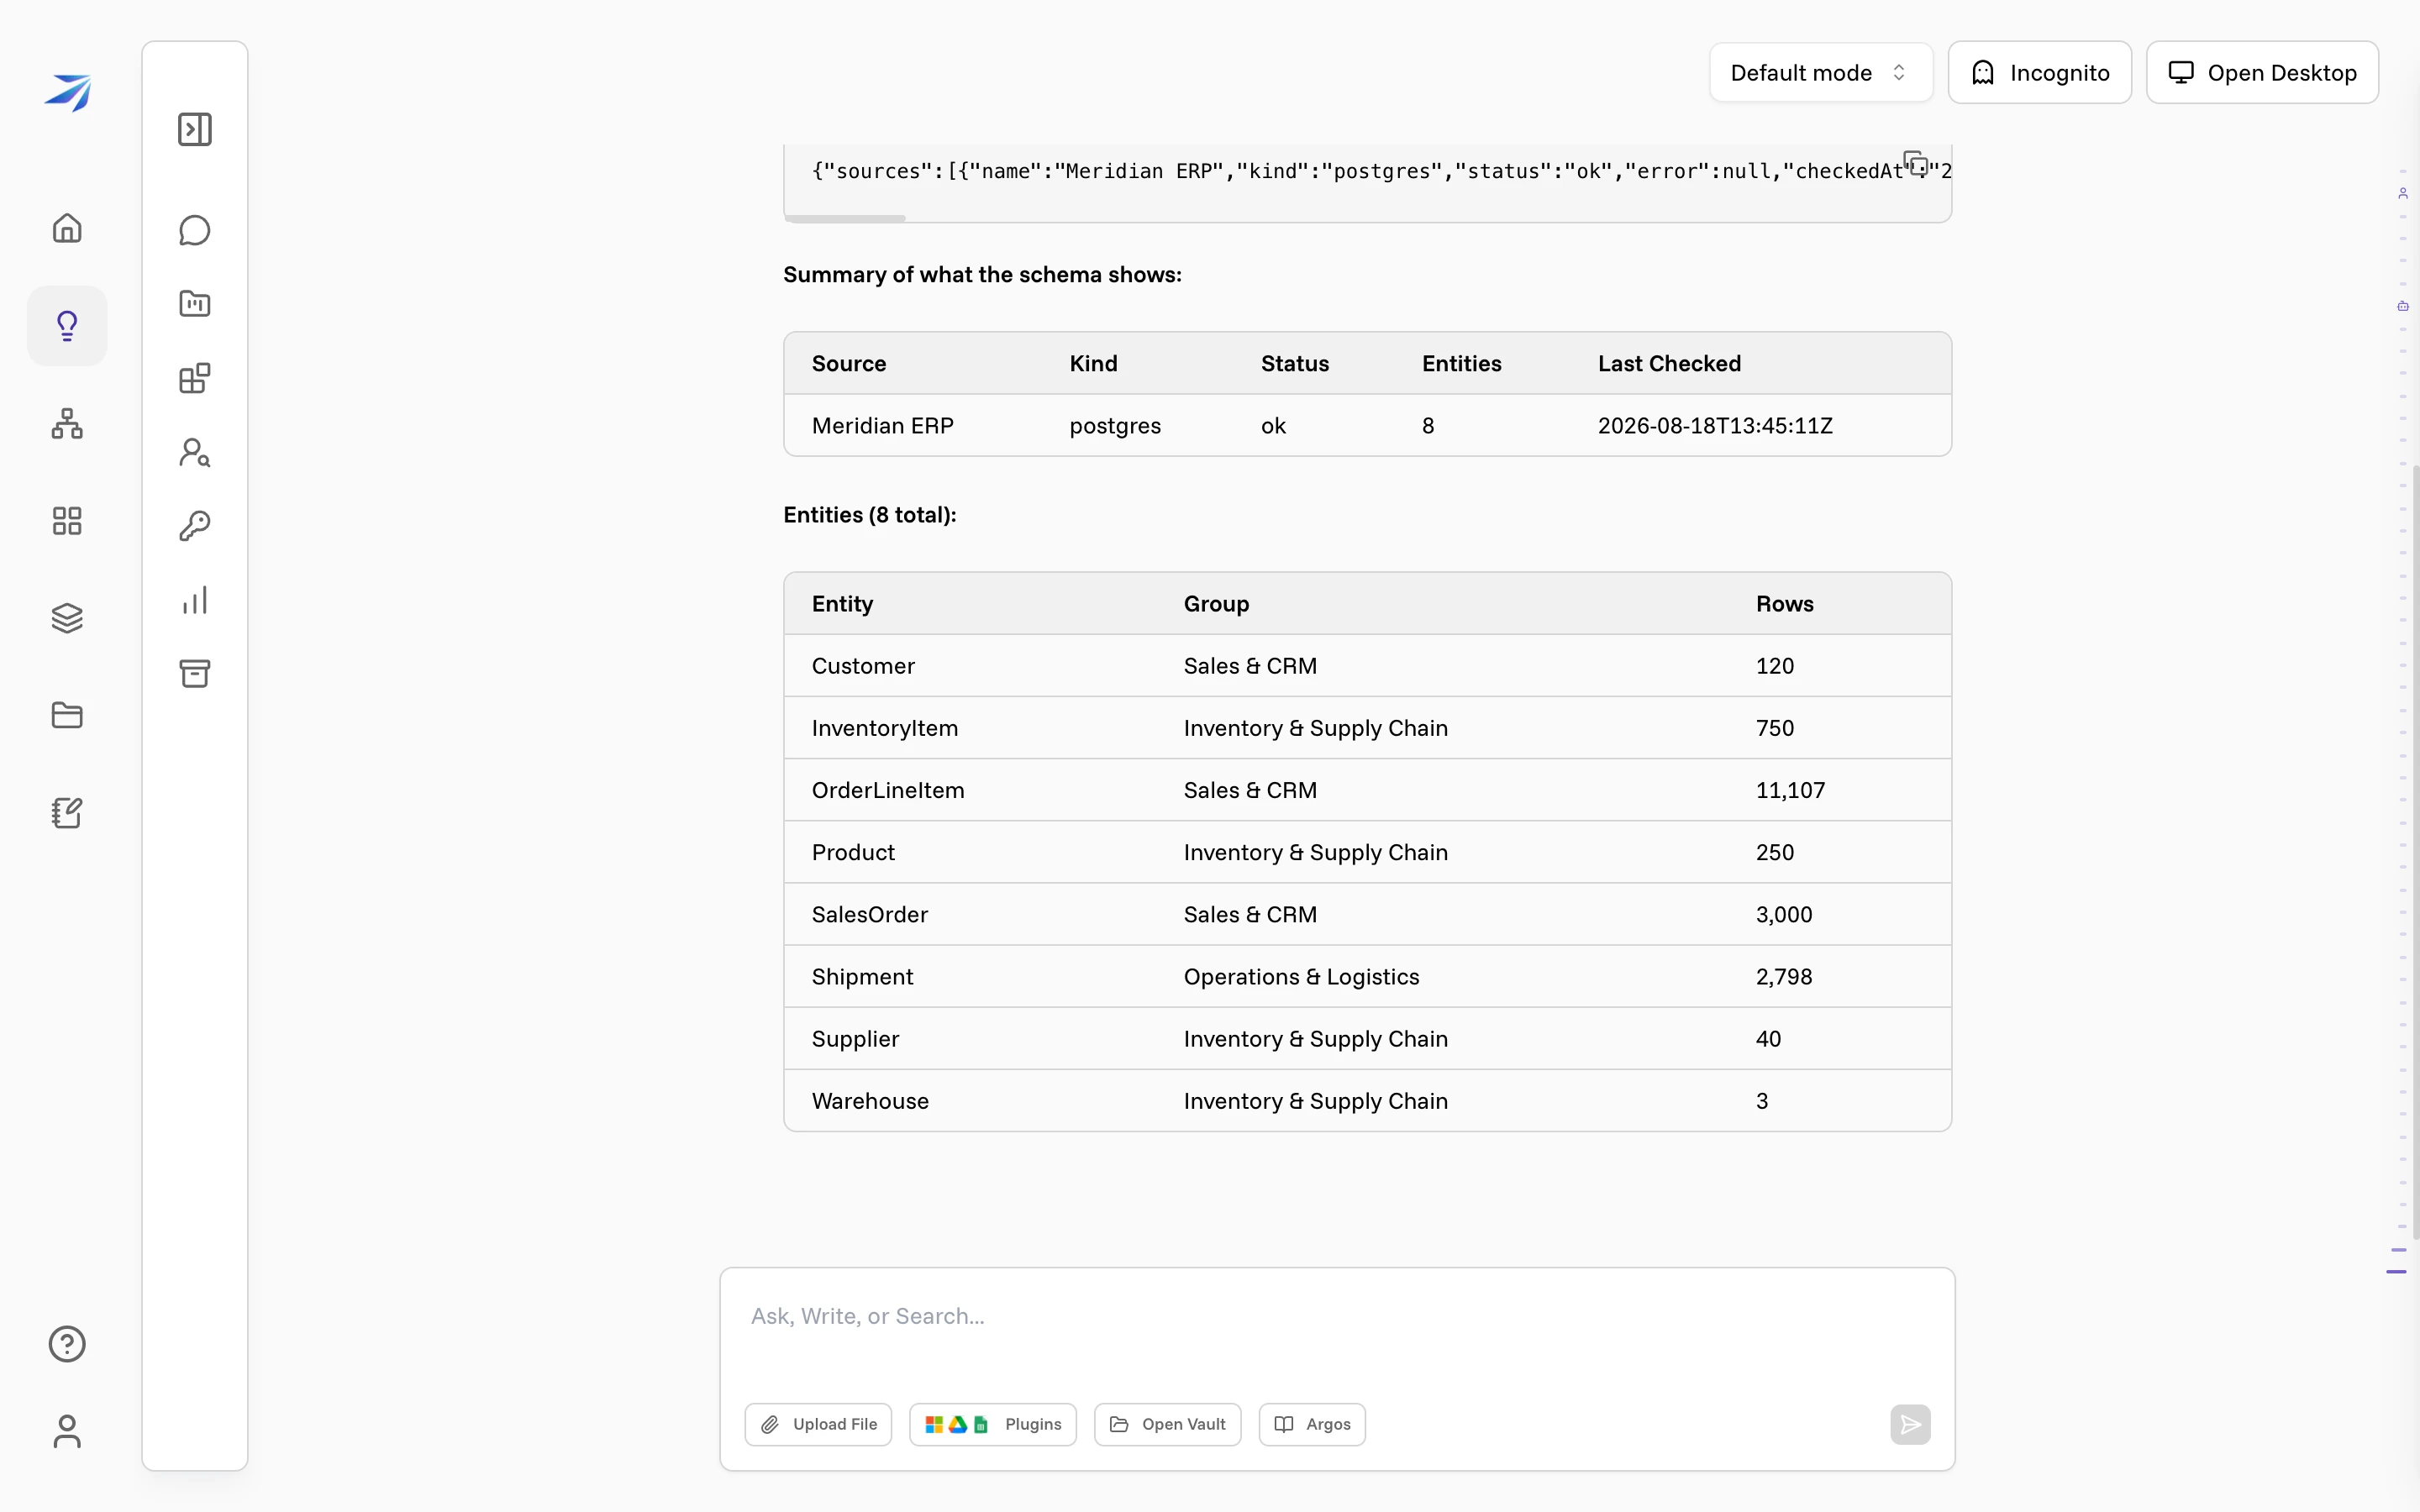
One call gives you every source in the organization with its live connection
status, and every entity you can read, with its row count and group. Access is
per field: an entity shows up once you can read one of its fields, and total
counts what you hold rather than what exists. See
Who can see what. On a big graph, filter instead
of paging: atlas schema --match orders searches names, tables, sources,
groups, field names, descriptions and sampled values. Entities page at 50 —
matched and offset tell you when you've seen it all.
status is the source's health at the moment you asked, and matched: 0 means
your terms found nothing, not that the data is missing. A source Atlas couldn't
open reads unreachable, and error carries the reason in words: an upload
that won't parse or a connection string that isn't valid names itself there
instead of arriving as an unexplained failure.
atlas describe — what a field will accept
$ atlas describe SalesOrder{"entity": "SalesOrder", "source": "Meridian ERP", "table": "orders",
"group": "Sales & CRM",
"description": "order_number is a human-readable identifier with format SO-YYYYMM-NNNN … status is a
low-cardinality code … subtotal_idr, discount_idr, tax_idr, and total_idr are monetary amounts in
Indonesian Rupiah with no stated unit; total_idr should equal subtotal_idr - discount_idr + tax_idr.",
"rows": 3000, "countError": null,
"grain": {"rows": 3000, "field": "id", "distinct": 3000},
"reportHeader": null,
"fields": [
{"name": "order_date", "type": "date", "nullable": false, "key": null,
"ops": ["eq", "neq", "gt", "gte", "lt", "lte", "isnull", "notnull", "in", "nin"],
"samples": ["2025-01-01", "2025-01-01"], "description": ""},
{"name": "status", "type": "string", "nullable": false, "key": null,
"ops": ["eq", "neq", "gt", "gte", "lt", "lte", "isnull", "notnull", "in", "nin",
"includes", "startswith"],
"samples": ["delivered", "delivered"], "description": ""},
…],
"links": {"out": [{"from": "SalesOrder.customer_id", "to": "Customer.id", "origin": "fk", "orphanRate": 0},
{"from": "SalesOrder.warehouse_id", "to": "Warehouse.id", "origin": "fk", "orphanRate": 0}],
"in": [{"from": "OrderLineItem.order_id", "to": "SalesOrder.id", "origin": "fk", "orphanRate": 0},
{"from": "Shipment.order_id", "to": "SalesOrder.id", "origin": "fk", "orphanRate": 0}]},
"totalFields": 10, "matchedFields": 10, "offset": 0}This is the densest command, and the one to read carefully.
opsis the legal condition list for that field, per field. An op that isn't listed is rejected, not ignored.grainis measured, not assumed: 3,000 rows, 3,000 distinctid— one row per order. On a line-level entity this is what stops you summing an order total once per line.linkscarries the relationships in both directions, with the share of rows that point at nothing (orphanRate).descriptionis what the enrichment pass wrote, including the units question — here, amounts in Rupiah that the columns themselves never label. It is blank on an entity you can read only part of, because the prose quotes field names and value ranges;graingoes null the same way when you cannot read the field it counts.reportHeaderis whatever a spreadsheet printed above its table, verbatim, when the source is a sheet.
--fields <substring> narrows a wide entity to matching fields (one substring,
not a list); fields page at 60.
atlas count — exact totals, several at once
$ atlas count SalesOrder Shipment Customer{
"counts": [
{
"entity": "SalesOrder",
"source": "Meridian ERP",
"count": 3000,
"error": null
},
{
"entity": "Shipment",
"source": "Meridian ERP",
"count": 2798,
"error": null
},
{
"entity": "Customer",
"source": "Meridian ERP",
"count": 120,
"error": null
}
]
}Counts run server-side over the whole set, and several entities sweep in one
call. Add --json '{"and": [...]}' to count matching rows instead of all of
them. If a count fails, that element carries an error and a null count — a
null is not a zero.
atlas query — rows, as a page
$ atlas query SalesOrder --json '{"and": [{"field": "status", "op": "eq", "value": "delivered"}],
    "sort": [{"field": "order_date", "dir": "desc"}], "limit": 3,
"fields": ["order_number", "order_date", "status", "total_idr"]}'{"rows": [{"order_number": "SO-202608-0066", "order_date": "2026-08-13T00:00:00.000Z",
"status": "delivered", "total_idr": "31846900"},
{"order_number": "SO-202608-0055", "order_date": "2026-08-11T00:00:00.000Z",
"status": "delivered", "total_idr": "1300500"},
{"order_number": "SO-202608-0053", "order_date": "2026-08-10T00:00:00.000Z",
"status": "delivered", "total_idr": "1978400"}],
"count": 3, "source": "Meridian ERP", "truncated": true, "total": null,
"warning": "truncated page: 3 of unknown matching rows. Totals or aggregates from this page are
wrong — use atlas count/agg for whole-set figures, or page with sort+offset."}Note what the envelope says about itself. truncated: true means these rows are
a page, not the set, and the warning spells out the mistake it's guarding
against. The limit defaults to 1,000 and tops out at 10,000; to page further,
add offset — and offset without sort is refused, because unsorted pages
can repeat or skip rows.
Filters take three shapes and no others: value ops (eq neq gt gte lt lte contains includes startswith) carry value, member ops (in nin) carry
values, and isnull / notnull carry neither. Groups inside or are ANDed
internally and ORed together. join attaches fields from a related entity;
unless a filter names one of those fields, every origin row comes back and the
unmatched ones carry null.
A join hop names four things: the origin entity, the referencing field on it, the target entity, and a key on the target. It does not need a relationship the graph already lists. Two entities in different sources join the same way. Atlas measures the target key before it joins, refuses the hop if that key repeats, and caps how many rows it will move.
When your filter values contain quotes or unicode, read the query from stdin
instead of fighting the shell: atlas query SalesOrder < query.json.
atlas agg — the whole set, grouped
$ atlas agg SalesOrder --json '{"groupBy": ["status"],
    "measures": [{"fn": "count"}, {"fn": "sum", "field": "total_idr", "as": "revenue"}],
    "sort": [{"field": "revenue", "dir": "desc"}]}'
{
"rows": [
{ "status": "delivered", "count": 2749, "revenue": "62123197500" },
{ "status": "cancelled", "count": 150, "revenue": "3004142700" },
{ "status": "shipped", "count": 49, "revenue": "1088358700" },
{ "status": "processing", "count": 35, "revenue": "699820300" },
{ "status": "pending", "count": 17, "revenue": "327702700" }
],
"path": "native",
"truncated": false,
"total": 5,
"caveats": [],
"source": "Meridian ERP"
}This is the command people skip and shouldn't. It aggregates over every matching
row on the source, so the counts sum to the entity's full 3,000 — a query page
would have summed three orders and looked just as confident.
measures— one to five ofcount,sum,avg,min,max,count_distinct. Name them withas;sortrefers to that output name, never to a source column. Over a filter that matches nothing,countandcount_distinctanswer0on every source kind, andsum,minandmaxanswernull.groupBy— up to three fields; a date field takes a grain (year,quarter,month,day).total— the number of groups, which is why an ungrouped grand total reports 1 however many rows it summed. It isnullexactly where the result carrieswindowed: true, which says the groups really were cut to your window, so the ones cut away were never counted. A top-N that had nothing to cut, because the set was smaller than the window, reports the real number and carries nowindowedflag at all.caveats— NULL groups, orphans, truncation. Part of the answer, not noise.
A sort on a measure plus a limit is a top-N, and the group budget below
never applies to it unless offset + limit passes 1,000. Every source Atlas
can scan answers one: a source that aggregates for itself is asked first, and
an overflow past the budget is ordered and cut in Atlas's DuckDB instead. A
native aggregate, Salesforce or a connector serving /aggregate, is pushed
measures only; wherever Atlas's own engine does the grouping, a group key sorts
as well as a measure.
$ atlas agg TransactionItem --json '{"groupBy": ["product_id"],
    "measures": [{"fn": "count", "as": "n"}],
    "sort": [{"field": "n", "dir": "desc"}], "limit": 5}'
The group budget is 1,000, and it bounds the groups that have to come back whole: an aggregate with no ordered window to cut them by, or a source that groups for itself but cannot window what it grouped. Over it, the command refuses rather than silently truncating: ask for the top-N, filter first, or group coarser.
When it refuses
A rejected command exits non-zero and prints one error object whose diagnostics name the fix. Asking for an op that doesn't exist:
$ atlas query Customer --json '{"and": [{"field": "segment", "op": "ne", "value": "retail"}]}'{"error": {"code": "compile-rejected",
"diagnostics": [{"code": "value-shape",
"message": "Ops are eq, neq, gt, gte, lt, lte, contains, includes, startswith, in, nin,
isnull, notnull. Use `includes` for substring matching and `in` for a set — there is no
`like`, `between` or `regex`. Only the ops `atlas describe` lists for a field are legal
on it."}]}}Two habits follow from that. Read the diagnostic and change what it names —
resubmitting the same shape gets the same refusal. And check the exit code:
piping atlas into anything swallows it, so a rejection reads as an empty
success. A refusal has no result, and a // 0 default in jq will happily turn
one into a real-looking zero.
A source that can't be opened at all refuses the same way, under
code: "source-invalid": an upload that won't parse, a file past the size Atlas
reads, a connection string that isn't a valid URL, a server below the version
its kind supports. Those messages are written to name the fix, which is what
makes them worth reading before a retry. Anything Atlas didn't write itself
stays a bare internal error, because a driver's own text can echo a connection
URL with the password in it.
When Atlas can't express something — comparing one field against another, say — it says so instead of approximating, and the route around it is usually an export.
atlas export — when SQL is the right tool
$ atlas export SalesOrder OrderLineItemExport materializes entities to typed parquet in ~/atlas/exports/ — real
DATE, TIMESTAMP and DECIMAL columns, so nothing needs parsing downstream. From
there it's DuckDB — already installed in the sandbox
— and ordinary SQL: medians, window functions, expression measures, the things
agg deliberately doesn't do.
It exports the full set, not a page. Above 500,000 rows it refuses until you
filter it with --json or answer the refusal with --force. Exports are
session scratch — they're wiped between sessions, so re-export for freshness
rather than trusting yesterday's file.
The rows stream to the file as they arrive, joined or not, so size costs time
rather than memory. The run has a 180-second server budget, and an export that
runs past it fails with a timeout and leaves no file behind, rather than
handing you a short one that looks complete. A file that exists is the whole
set. --force on a large export can run close to that budget, so raise your own
command timeout past it.
Reach for export after agg, not instead of it. A join you run yourself in
DuckDB has none of the duplicate-key guards the engine hop applies. Spanning two
sources is not on its own a reason to export: write the join hop first, and let
export answer the refusal if one comes back.
When the command line is the right surface
- Sweeps. Ten entities counted in one call, or a
--matchacross every source, beats ten clicks. - Scripts. The output shape is fixed, so
jqpipelines and cron-able scripts keep working. - Real SQL. Export plus DuckDB covers the analysis Atlas won't compile.
- Reproducibility. A query in a file is a query you can diff, review and run again.
For a sentence-shaped question, or a table you want to look at once, the Atlas chat and query console are faster. For anything you'll do more than twice, write it down here.